Market Update: October 21
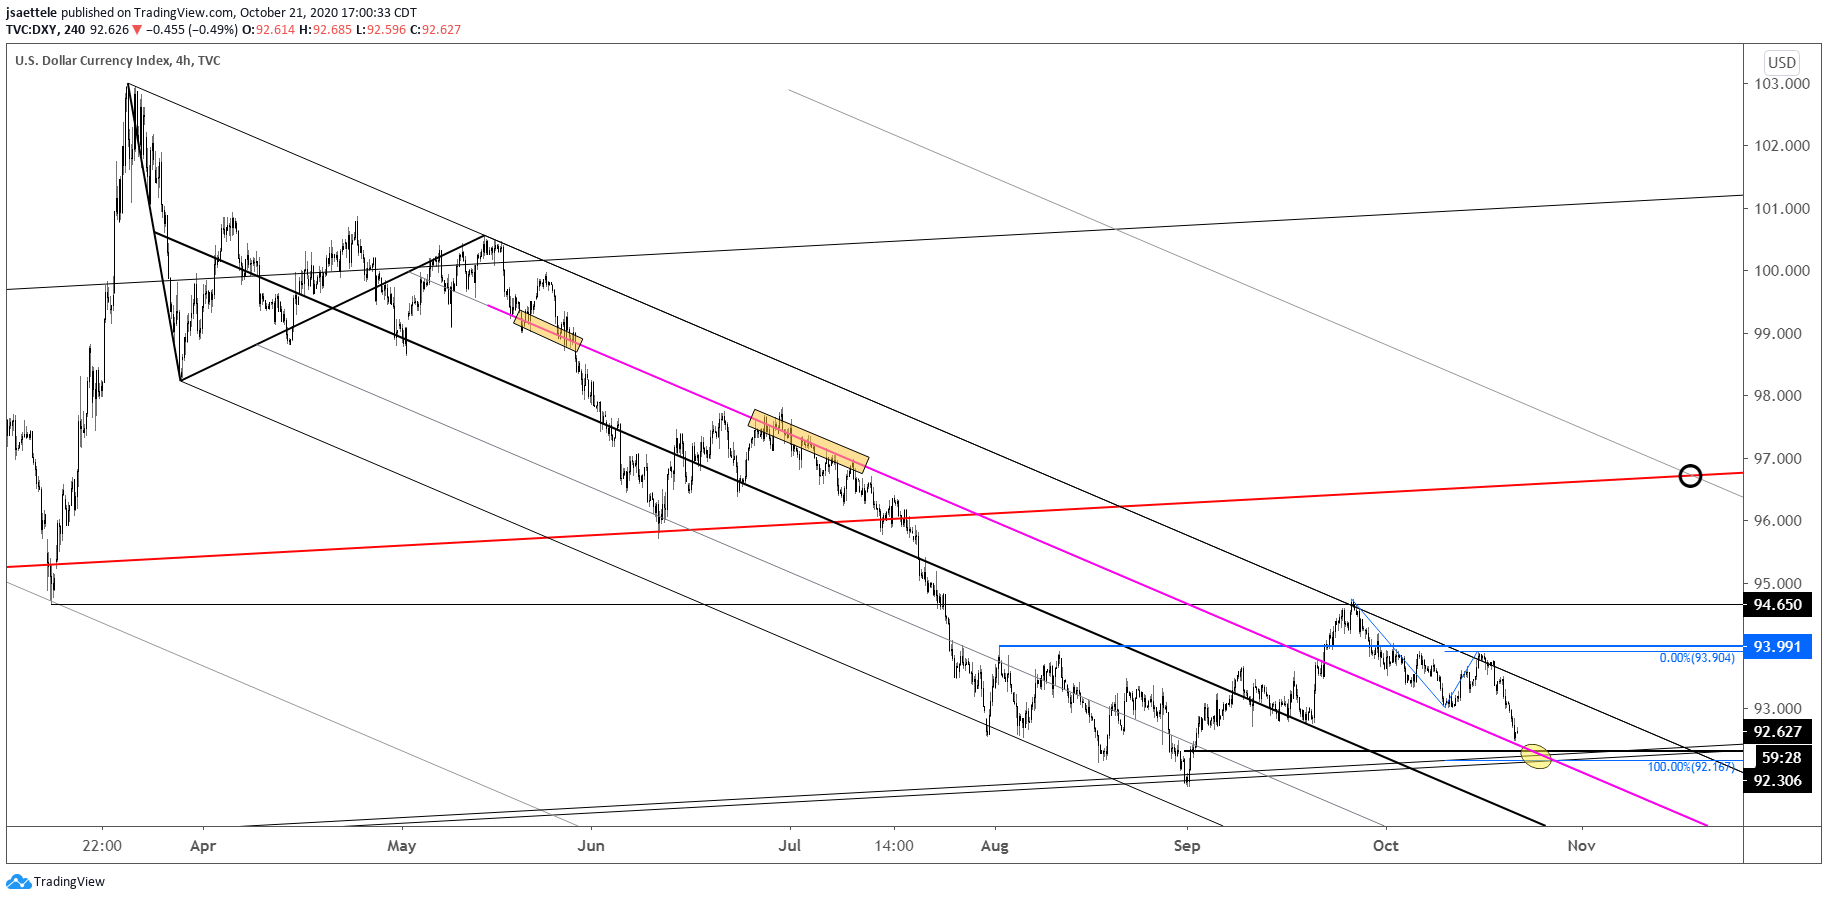
DXY 4 HOUR

There is no change to DXY comments/opinion but I wanted to reproduce this chart because the index is nearing critical support at 92.17/30. The level is defined by long term trendline support (see longer term chart below), daily reversal support, and 2 legs down from the 9/25 high. This needs to hold if the range from late July is going to resolve to the upside.
10/20 – DXY continues to fail at channel resistance and ABOVE 94 is still needed to signal that trend has shifted from sideways to up. Until/unless that happens, be aware of another test of the long term support line near 92.30 (daily reversal support). 2 equal legs down from the 9/25 high would be 92.18. A longer term chart is shown below in order to remind that important support is under the market.
DXY WEEKLY

GBPUSD 4 HOUR

GBPUSD is testing the median line from the near term bullish fork for the 5th time since late September. If price pulls back, then former resistance is proposed support at 1.3083. There are 2 upside levels to be aware of; July/August resistance at 1.3270 (year open is 1.3250) and daily reversal resistance at 1.3382.
USDJPY 4 HOUR

USDJPY completed a short term head and shoulders top today. The pattern might ‘launch’ the next leg lower within a multiyear downtrend. Former support at 104.94-105.04 is proposed resistance. Downside levels of interest are daily reversal support (3/9 close) at 102.35 followed by the long term channel center line near the 2016 (U.S. Election) low at 98.79 (see long term chart below).
USDJPY DAILY

AUDUSD 4 HOUR

Broader downside remains favored in AUDUSD. Resistance should be .7158/90. The lower end of the zone is the 61.8% retrace of the decline from 10/9 and the month open. The upper end of the zone is the 9/9 low. VWAP from the 9/1 high is currently .7182 as well (see futures chart below).
AUSTRALIAN DOLLAR FUTURES 4 HOUR

EURAUD DAILY

EURAUD is pulling back following its breakout above the MAJOR 1.6600 level. Look for the level to hold as support now and for EURAUD to resume higher towards the 1.7114 objective.
10/19 – EURAUD broke above a MAJOR level today. The level in question has been significant since August 2015 (see longer term chart below). The cross also completed an ascending triangle bottom. The measured objective is 1.7114. The breakout level at 1.6590 should provide support now.


