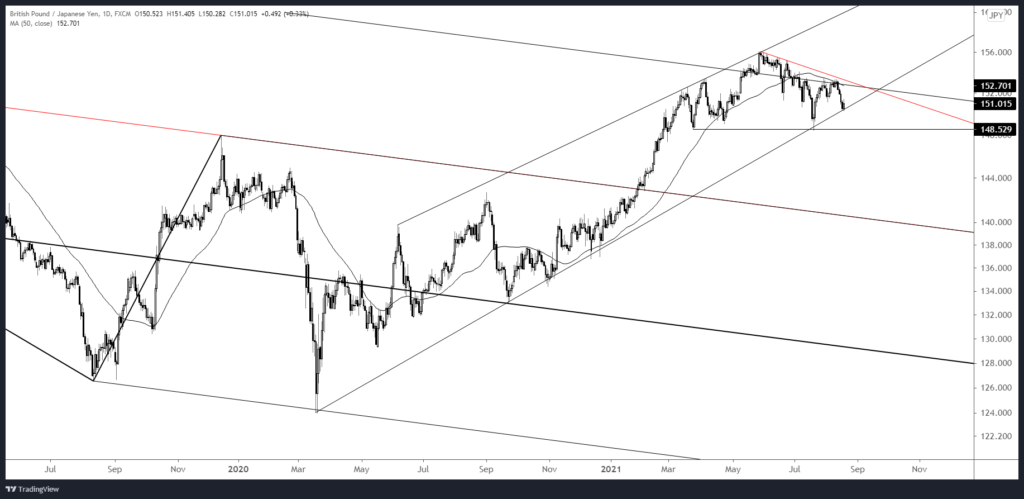
Market Update 8/18 – A BIG GBPJPY Setup
SPOT SILVER DAILY

Silver has responded to the noted red line. Extend the line to the left and you’ll notice that the line crosses pivots going all the way back to the high! In other words, ‘the market made this line’. Bottom line, silver looks like death…as long as price is under yesterda’s high.
8/16 – Silver is also fast approaching proposed resistance. Again, the level in question is about 24.05 and is defined by the line that crosses former lows (red line).
CRUDE OIL FUTURES DAILY

Crude failed just before 70.18 last week and it’s dropped every day since. Median line acceleration was on display today (in copper too by the way…see yesterday’s post…). The big test is 62.27, which is 2 equal legs down and the lower channel line.
8/12 – ‘Ideal’ crude resistance is 70.18. This is the 8/6 high and the 25 line within the bearish channel from the high. Again, median line symmetry in action (the recent low was on the 75 line)!?
USDCAD DAILY

USDCAD is into the noted 1.2650/60. The underside of the trendline is about 1.2690. Make no mistake, the USD has broken out (USDOLLAR) BUT if the breakout fails then USDCAD is a good spot to look. USDCAD downside is NOT my base case (especially given crude’s look). Simply be aware of 1.2690ish. If price reverses lower from near there then I’ll entertain the short side.
8/16 – USDCAD strength has resumed and focus is now on 1.2650/60. The zone is defined by the April high and 61.8% retrace of the decline from 7/19. The underside of the former trendline is closer to 1.2700. Watch for near term support at 1.2530/40.
NZDJPY DAILY

NZDJPY is pressing against the median line for the 4th time in the last few months. The risk is for median line acceleration. In other words, crash risk is high. Today’s bounce failed at former support which allows for a bearish stance against today’s high. If the median line gives way then watch for resistance from the underside of the line. Downside focus on a break is the lower parallel and the well-defined 72.00 level.
GBPJPY DAILY

GBPJPY did indeed roll over from the 50 day average and price is testing the well-defined trendline from the March 2020 low. A massive head and shoulders pattern is evident and the target on a break would be near 140. Watch for resistance near 151.80 (see 4 hour chart below).
8/5 – Recall that USDJPY 110 is an important level (see yesterday’s post). With that in mind, there are several other Yen crosses that are nearing possible inflection points (or important range expansions). GBPJPY 153.40/80 is a zone to know. The 50 day average, a host of daily highs/lows, and the trendline from the May high define the zone.
GBPJPY 4 HOUR


