Market Update 8/17 – USD Breakout?
S&P 500 FUTURES (ES) 4 HOUR
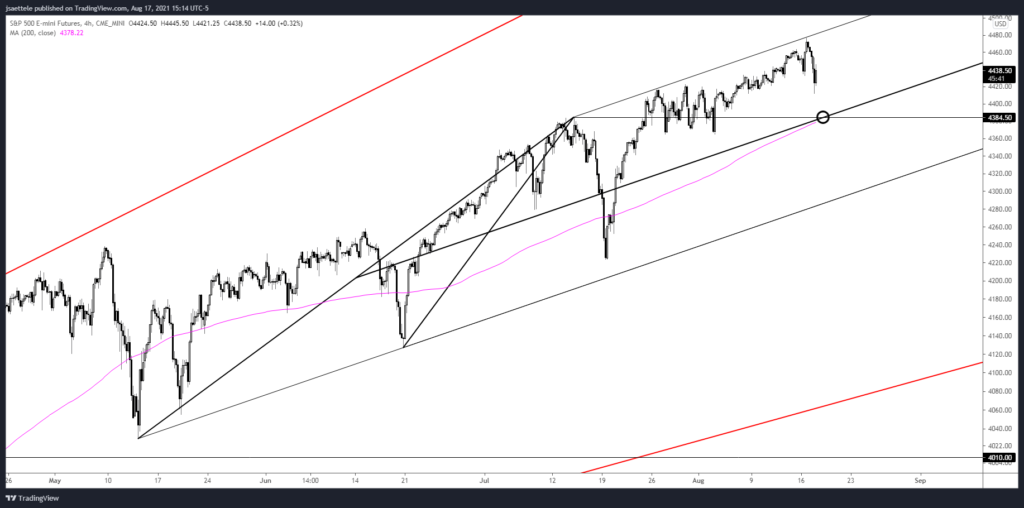
For the first time in quite a while, there is reason to discuss ES. The channel from the May low is operable and price just turned down from the upper parallel. As such, pay attention to the center line. This line intersects the 7/14 high at 4384.50. Watch the level for support BUT a drop below would indicate a behavior change and the underside of that line would then become proposed resistance. There are times to act and times to observe. This is a time to observe.
COPPER FUTURES DAILY
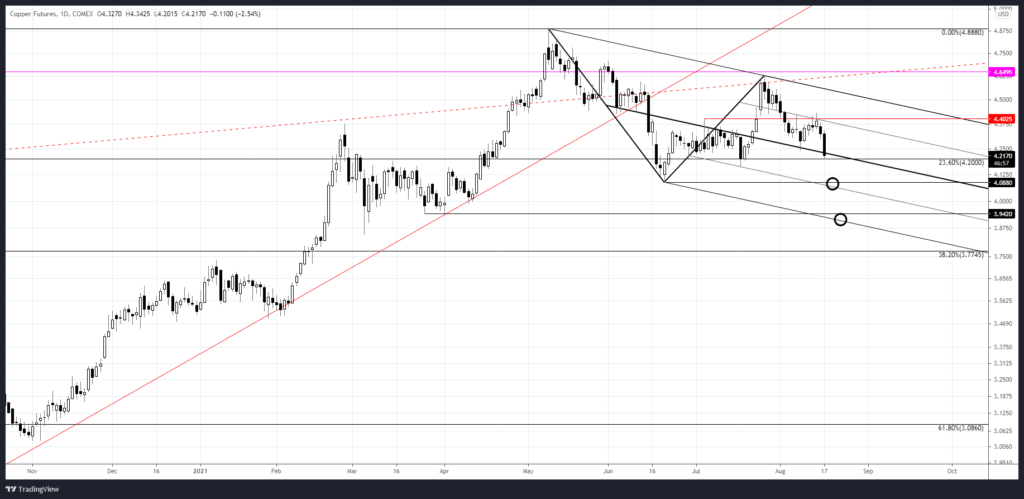
Simply beautiful. Copper turned down from parallel resistance (25 line). Remember, the action on parallels within the downtrend channel strongly suggests that the broader trend is indeed lower. Price is testing the median line so beware of median line gap risk (strong drop under the center line). The next levels on the downside are the 75 line and lower parallels…both lines are just under horizontal levels of 4.088 and 3.942.
8/12 – Copper hit resistance and turned lower. A tag of the upper parallel isn’t out of the question but the action on parallels within the downtrend channel strongly suggests that the broader trend is indeed lower. That’s important information and I’m trading from the short side. A drop under the median line would warn of downside acceleration with the next bounce level near the 75 line, which intersects the low at 4.088.
USDOLLAR DAILY
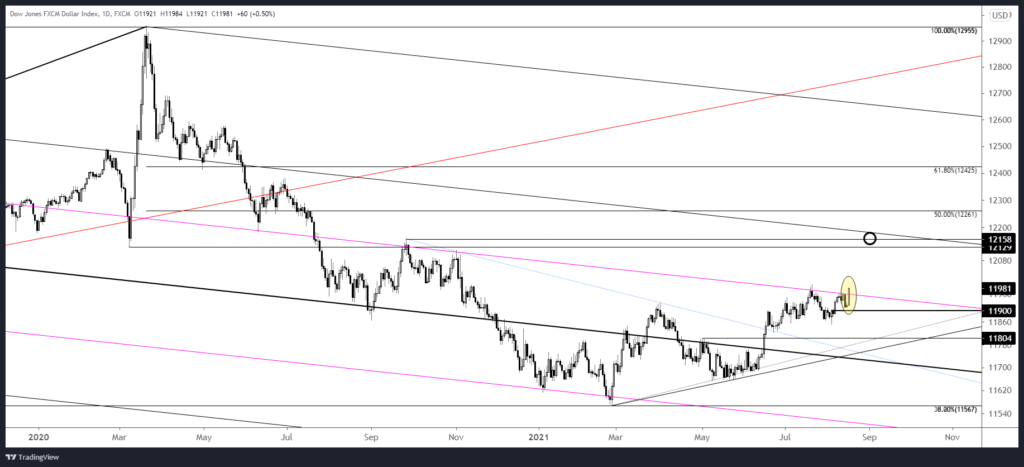
The USDOLLAR pullback bottomed at 11911…just above 11900. Is this a massive breakout? It is until it isn’t (then it would be a failed breakout). Risk is higher until noted otherwise with focus on 12129/60.
8/11 – Right on cue! USDOLLAR reversed lower from parallel resistance (again) today. I’m not sure how important the high is but short term focus is lower for now. The first level to pay attention to will be 11900.
EURUSD DAILY
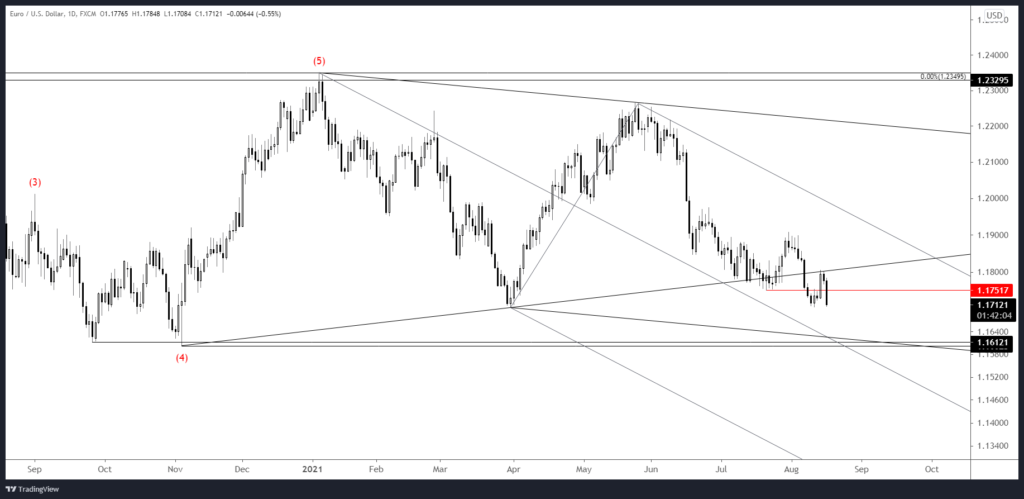
It turns out that 1.1800ish was important resistance for EURUSD. The 1.1600 (November low, channel low, and median line) level looms as a massive test…I’ll reassess if reached. Resistance to short is 1.1750 (7/21 low and 8/11 high).
8/16 – EURUSD has traded into proposed resistance at 1.1800 but near term pattern is unclear. In fact, another push higher would make the rally from the low in 5 waves and suggest that a more important low is in place. If price does push slightly higher then watch for resistance near 1.1830.
AUDUSD DAILY
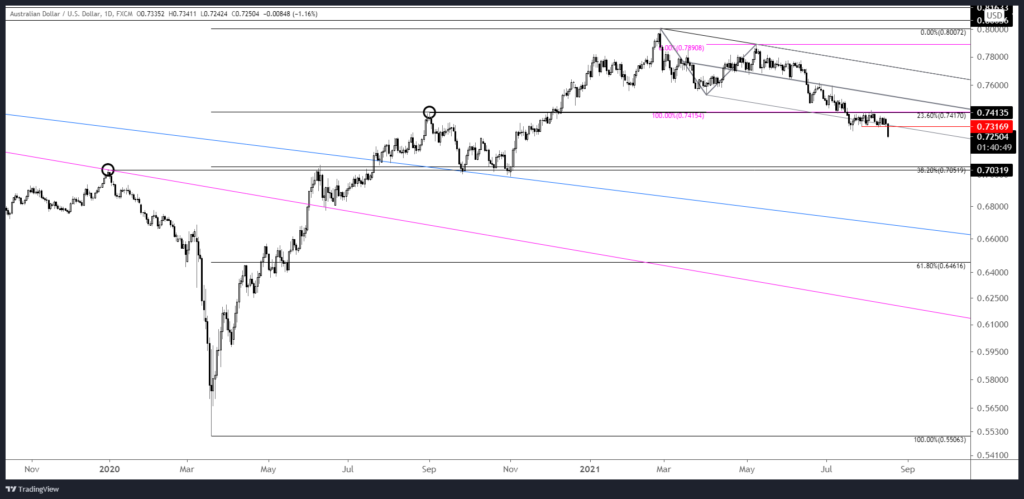
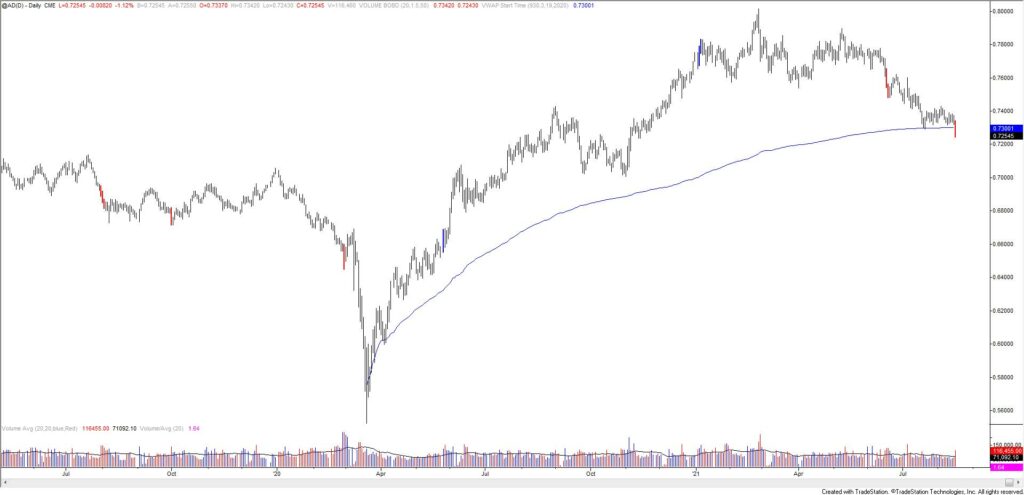
AUDUSD finally broke down. Is this move ‘for real’ or a ‘trap’. It’s impossible to know at the moment. I can make arguments for both. The next critical downside level isn’t until .7000/50 but volume on futures was high today which warns of capitulation (see futures chart below with red and blue bars denoting high volume levels at at least 50 day highs/lows). Bottom line, proposed resistance is .7290-.7315 and I’m bearish as long as that zone is respected.
8/11 – Aussie is a hot mess. Price remains capped by the massive .7415 but the wedge is morphing. I’m not interested in AUDUSD until price breaks above .7415 (possibly bullish given the VWAP hold…see below) or to new lows. A break above .7415 would face a test from .7500/30.
AUSTRALIAN DOLLAR FUTURES DAILY
NZDUSD DAILY
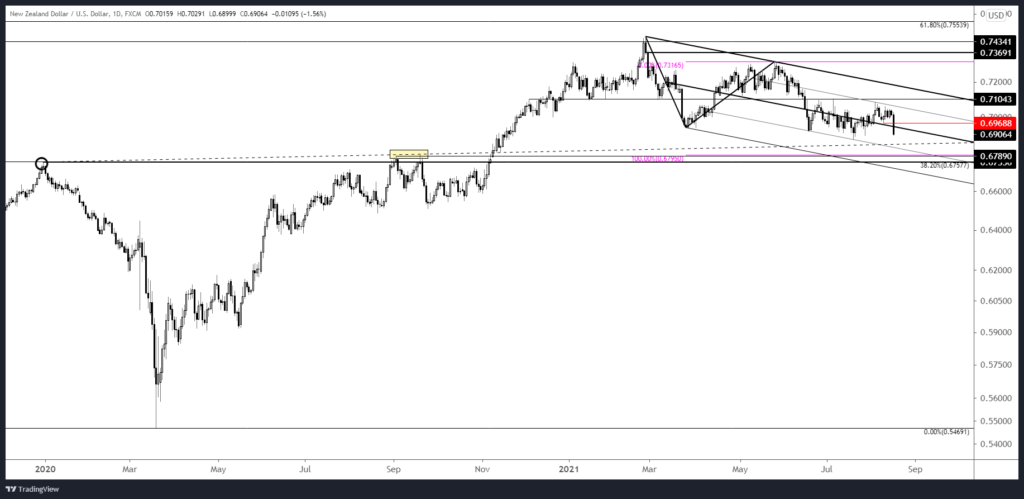
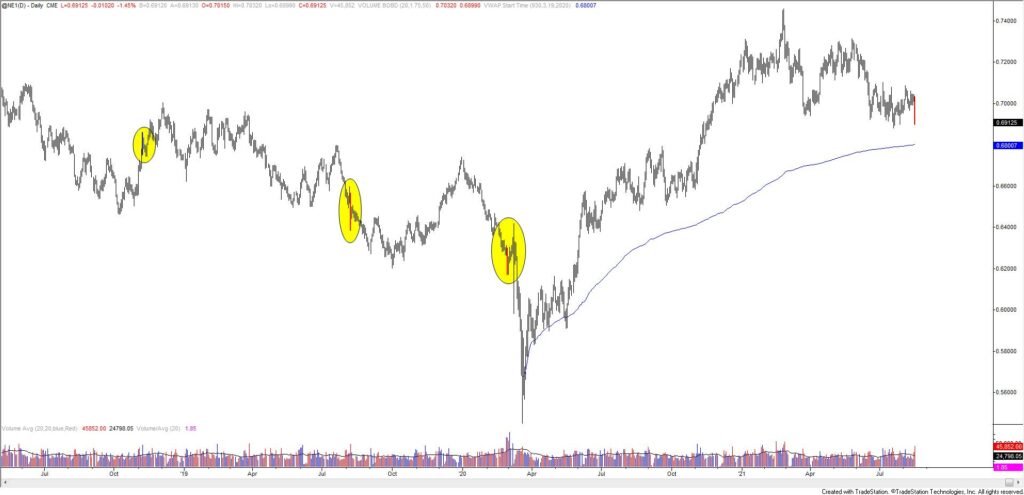
NZDUSD eyes remain on .6800 (or so). Recall that .6800 is 2 legs down from the February high AND VWAP from the 2020 low. The bottom of the channel is now about .6700 so let’s call .6700-.6800 a critical zone. The high volume capitulation logic explained regarding AUDUSD applies to Kiwi (see futures chart below). Proposed resistance is .6950/65 (former support and month open).
8/10 – NZDUSD reversed just before .6960 but 5 waves down from the 8/4 high keeps the bearish view on track. .7040 is the 61.8% retrace and daily reversal resistance…watch that for resistance now. From an extremely short term point of view, .6990 or so may provide support for a small B wave.
NEW ZEALAND DOLLAR FUTURES DAILY
