Market Update – September 14
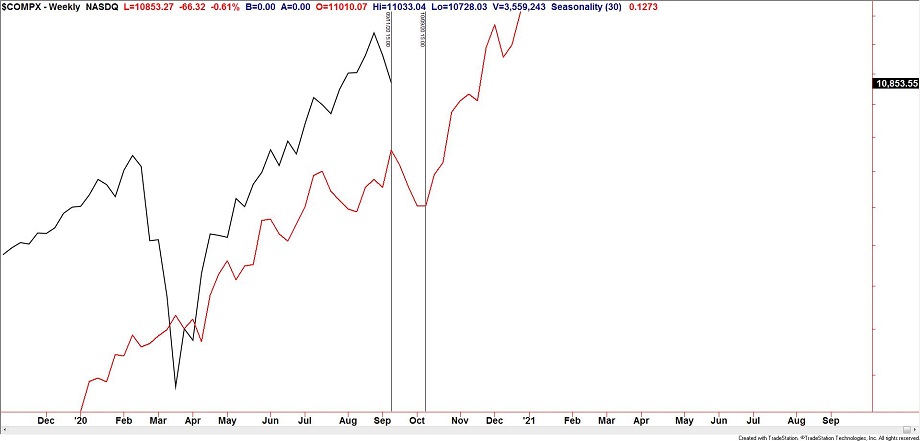
NASDAQ COMPOSITE WEEKLY SEASONALITY
I don’t have much to add to recent updates from a price perspective so I’m highlighting several longer term observations in today’s update.
The most bearish time of the year for equities is now through October 9th.
9/10 – QQQ pushed slightly above the noted 279 before turning down. The next level of interest is the long term parallel (magenta line) near 257. The chart with volume studies below highlights some important observations. First, VWAP from the high was resistance today. Second, the importance of 237.50 (February high) is magnified by VWAP from the March low.
EURUSD WEEKLY SEASONALITY

EURUSD seasonal tendencies are negative through November.
9/10 – Just about pip perfect in EURUSD…high today was 1.1918. Below 1.1750 would confirm a head and shoulders top. The head and shoulders top objective would be 1.1490…in line with the March high! The week open at 1.1845 is proposed resistance for Friday and action since the 9/3 low ‘counts’ as a complex flat correction (see 30 minute chart below).
GBPUSD WEEKLY SEASONALITY

GBPUSD seasonal tendencies are almost negative through November. Cable has closely tracked its seasonal tendencies for most of 2020.
SWISS FRANC FUTURES DEALER POSITIONING

Dealer net positioning in Swiss Franc futures is the most negative since at least 2010. Dealers tend to be extremely long an asset near a price low and extremely short near a price high. This is bearish CHF (bullish USDCHF). On the price chart, USDCHF (see below) has been trading around a well-defined level since late July. The level in question is the 38.2% retrace of the rally from 2011 and channel support. Near term, a head and shoulders (recall the possible h&s patterns noted in the 9/10 post) bottom is possible since late July. Above .9200 would confirm the pattern.
USDCHF WEEKLY

USDCHF 4 HOUR


