Market Update – September 11
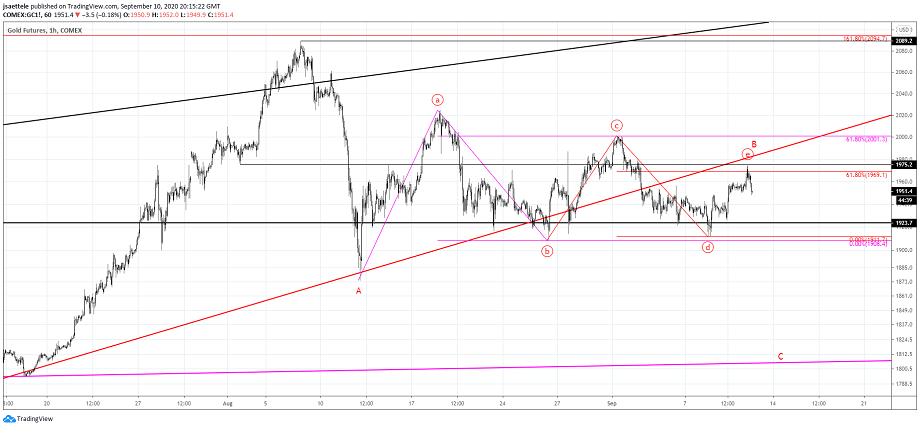
GOLD FUTURES HOURLY
My working assumption is that a B wave triangle ended today at 1975.20 (exactly the 8/3 low) in gold. I am bearish against today’s high and looking for weakness lower in a C wave towards 1800 or so by the end of the month.
9/8 – Action since the August low in gold is a triangle…specifically a B wave triangle. Proposed resistance for wave e and the end of the triangle is 1969 (the equivalent level in spot gold is 1962). This is where wave e would equal 61.8% of wave c. Notice how wave c is exactly 61.8% of wave a. 61.8% relationships between alternating legs in triangles is common. It’s too early to think about eventual wave C downside but the analog that we’ve been following for quite for some suggests downside through September (see below) into 1800 or so.
COPPER WEEKLY

Copper broke above the trendline from the 2011 high last week and is on the verge of making a weekly bearish engulfing candle pattern, leaving a failed breakout above a major trendline in the process. Many incorrectly label outside days as engulfing patterns. A true engulfing pattern only takes into consideration the bodies of the candle. So, for a bearish engulfing pattern, a gap above the prior close is required followed by a close below the prior open. This happened today actually in SPY, QQQ, and DIA. Let’s see where the doctor closes tomorrow.
QQQ HOURLY

QQQ pushed slightly above the noted 279 before turning down. The next level of interest is the long term parallel (magenta line) near 257. The chart with volume studies below highlights some important observations. First, VWAP from the high was resistance today. Second, the importance of 237.50 (February high) is magnified by VWAP from the March low.
9/8 – QQQ has broken down and the same levels are in focus that were noted yesterday (text below). All I’m adding is that if price bounces from here (a gap up on news tomorrow for example) then 279 is proposed resistance.
QQQ HOURLY

SPY HOURLY

VWAP from the high was also resistance in SPY today. The next level of interest is 323-324 (June high and VWAP from the June low). The major level to note is 297, which is he June low and near both VWAP from the March low and 2020 VWAP. I’ve included the long term SPX trendline charts below because they are awesome.
SPX MONTHLY

SPX WEEKLY

DXY 4 HOUR

DXY tagged the top of the former wedge line and immediately turned up. A possible head and shoulders bottom is visible (there are a lot of these patterns in FX at the moment). The measured move on a break higher is 95.20…which is the trendline from the March high. 94.09 is still a possible hiccup area but make no mistake; DXY looks more constructive each day.
9/9 – Watch for support in DXY from the top side of the just broken wedge barrier near 92.55. 94.09 is the next upside level followed by the noted 95.18. 94.09 is a longer term parallel that was support in 2018 so it’ll be important to see what happens at that level if reached (see daily chart below).
EURUSD 4 HOUR

Just about pip perfect in EURUSD…high today was 1.1918. Below 1.1750 would confirm a head and shoulders top. The head and shoulders top objective would be 1.1490…in line with the March high! The week open at 1.1845 is proposed resistance for Friday and action since the 9/3 low ‘counts’ as a complex flat correction (see 30 minute chart below).
9/9 – EURUSD is stuck between its wedge barrier and the underside of the channel from the May 14th low. Where to after ECB tomorrow? If the reaction is higher, then pay attention to 1.1910 for resistance. This level is also the 61.8% retrace of the decline and the upper parallel from a short term bearish fork. If it’s lower, then below 1.1750 should unleash downside towards 1 1.1400 handle.
EURUSD 30 MINUTE

USDNOK 4 HOUR

USDNOK appears extremely bullish near term given the notably higher right shoulder of the h&s that’s been forming for nearly a month. Above 9.19 should lead to acceleration towards 9.60 (measured objective) although I maintain that 9.87-9.98 is a broad upside magnet.
9/7 – USDNOK reversed sharply last week from the line off of the 2016 and 2018 highs. This line was precise resistance AND support in 2019. The area around last week’s low has been a major horizontal level since 2016. I also like that the 200 week average is just under the low. General upside focus is 9.87-9.98. This is the former 4th wave high (5 waves down from the March high) and 38.2% retrace of the drop.
AUDUSD 4 HOUR

AUDUSD high was on the center line and 4 pips shy of the 61.8% retrace. Beautiful. Below .7190 is needed in order to get this rolling downhill but today’s action is unmistakably bearish. You can’t ask for a better spot for a lower high. Action since the 9/4 low satisfies requirements for a flat correction as well and the week open at .7285 is proposed resistance (see 30 minute chart below).
9/9 – Keeping with RSI range rules, the blue bars on this AUDUSD chart indicate when RSI crosses above 75. The red bars indicate when RSI crosses below 25. Since late 2019, there have been 4 such crosses. These ‘extreme’ readings indicate trend changes. Following both crosses above 75, the next price lows occurred when RSI pulled back to 40. Following the cross below 25, the next price high occurred when RSI bounced to 60. RSI has moderated to 55 following this latest drop under 25. Watch for a price high when RSI is near 60. Price wise, the center line and 61.8% retrace of the drop at .7329 are proposed resistance (see below chart).
AUDUSD 30 MINUTE

USDCAD 4 HOUR


