Market Update 4/25 – Fed Capitulates on Bonds
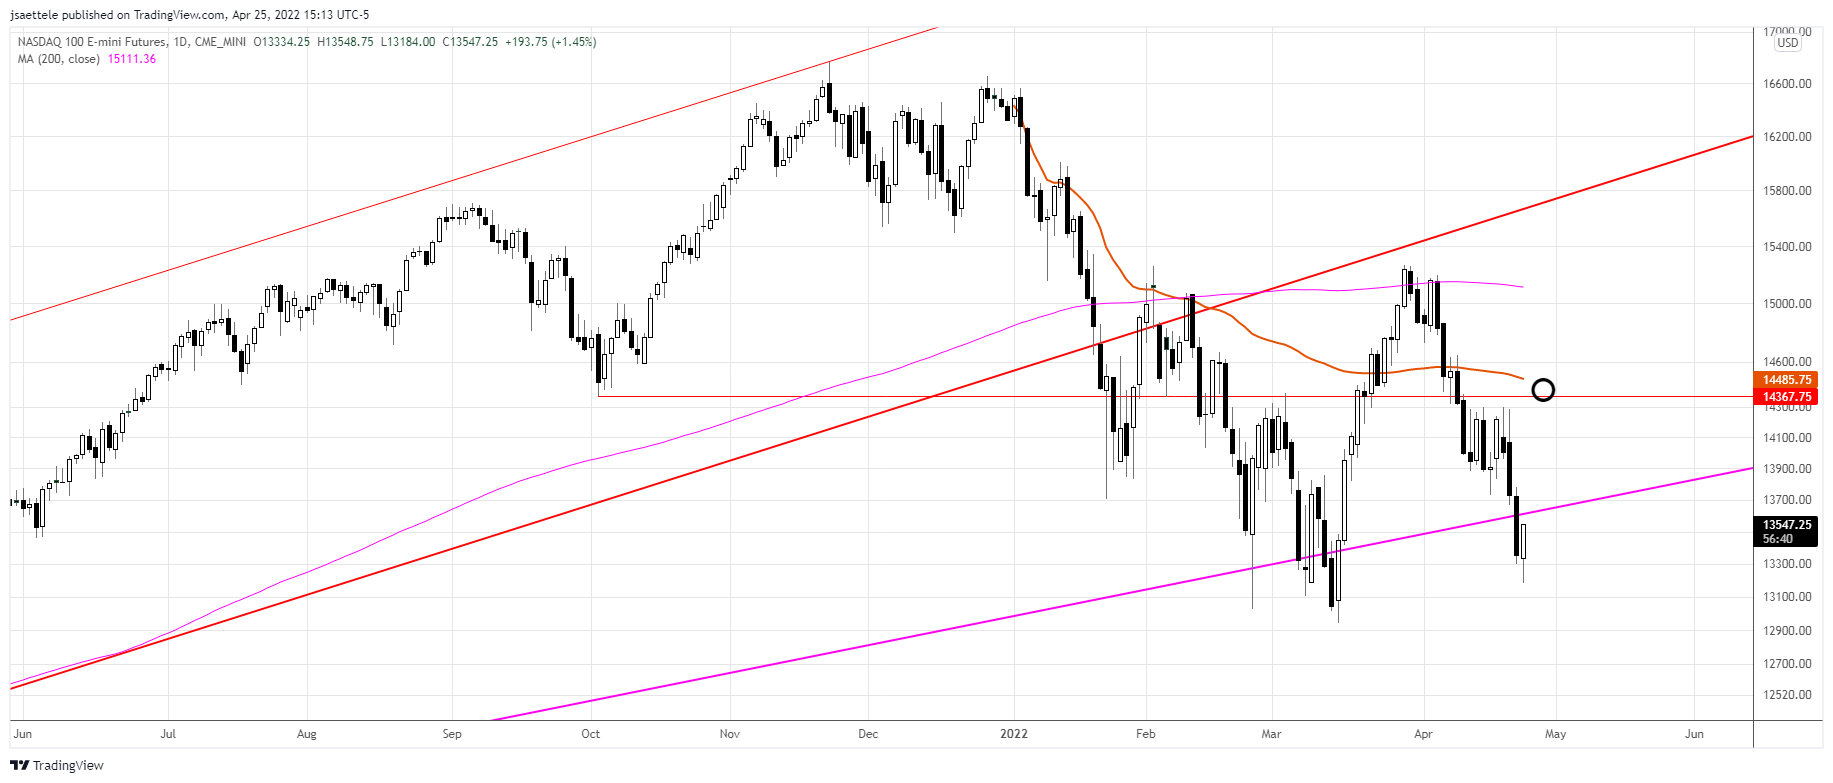
NASDAQ FUTURES DAILY
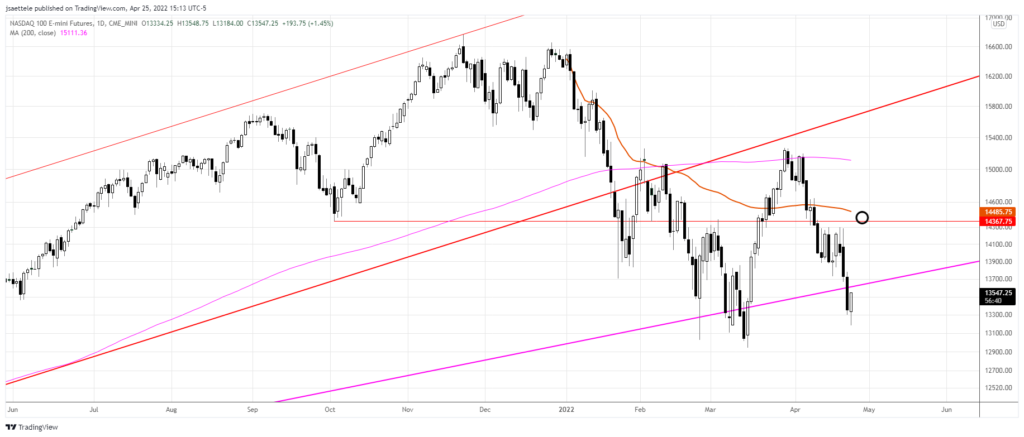
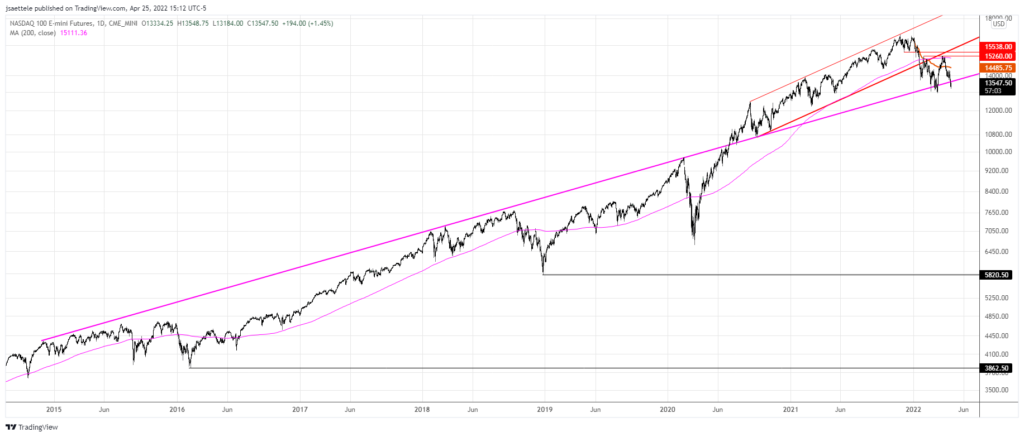
The Nasdaq is holding on for dear life. Price continues to trade around the well-defined trendline that crosses highs over the last 8 years (see zoomed out chart below). Bigger picture, one must acknowledge that trend is sideways at best and possibly down with price below the 200 day average and that average shifting from a flat to a negative slope. Near term, today’s reversal sets up for a squeeze higher with resistance in the 14300-14500 range. A relief rally is needed in order to relieve extremely negative sentiment.
Do you make a profit trading Nasdaq?
Try our funded trader program and get up to $1,000,000 in funding.
Learn more
NASDAQ FUTURES DAILY
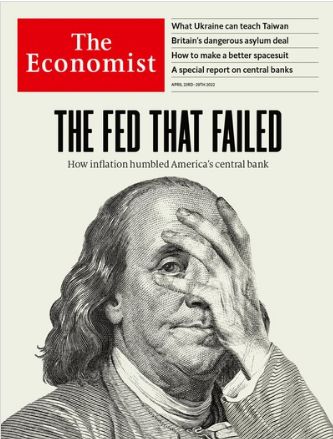
THE ECONOMIST
The following is an excerpt from chapter 3 of Sentiment in the Forex Market
“A major magazine would not devote its cover story to a financial market unless the story in question was considered newsworthy. A story (especially one about the value of a currency) is not considered newsworthy to a major magazine unless the public is obsessed with the story, and an obsessed public defines extreme sentiment. Since sentiment extremes accompany market turns, by association, major magazine covers are contrarian indicators and signal market turns.”
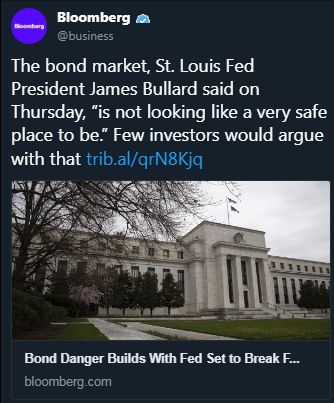
I’m not arguing that the Fed hasn’t failed but The Economist acknowledging the failure screams bond market low from a sentiment perspective. Also, Bloomberg reports (see below) that even Bullard recognizes that the bond market isn’t a safe place to be. Bullard is a hawk but he wasn’t expressing these thoughts BEFORE the bond market imploded! This reminds me of the November 2005 GBPUSD low, when the Bank of England remarked that ‘the USD looked like a buy’. As Jared Dillian noted over the weekend, ‘Fed officials aren’t known for their market timing.’
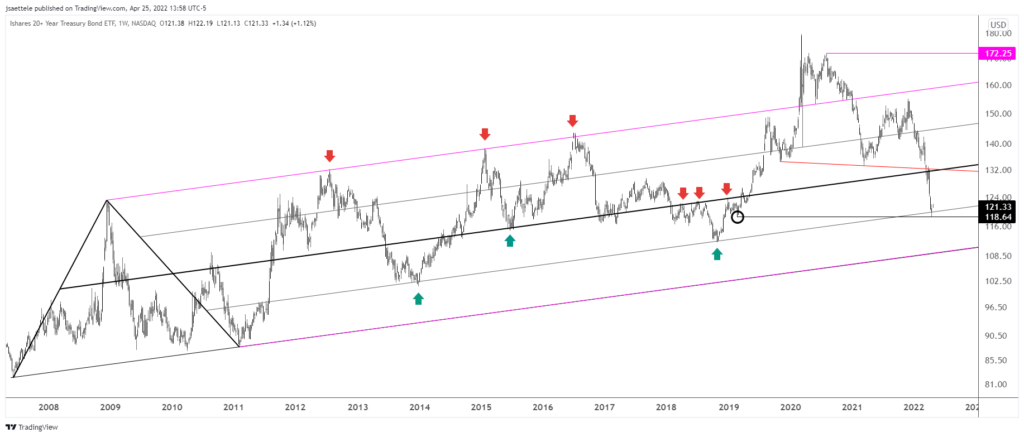
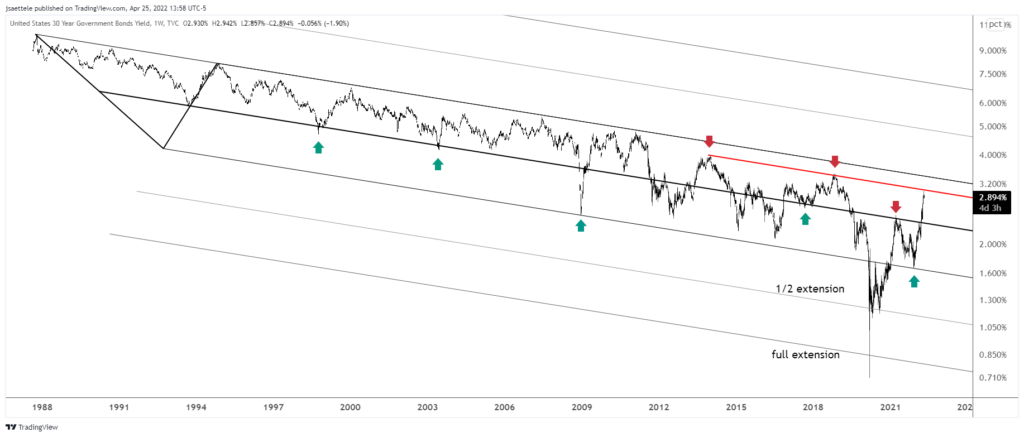
4/19 – My gut is that we’re close to a turn higher in bonds and lower in USDJPY. The next few charts make that ‘argument’. This TLT chart shows TLT with a synthetic volatility indicator (the indicator attempts to produce a VIX). Extremely high readings occur at market lows. The current reading has only been seen 4 times in history; March 2020, twice in 2009, and in 2003 (see below). Don’t forget about the long term parallel on the price chart (2 charts down) as well.
TLT WEEKLY
U.S. 30 YR YIELD WEEKLY
USDCNH DAILY
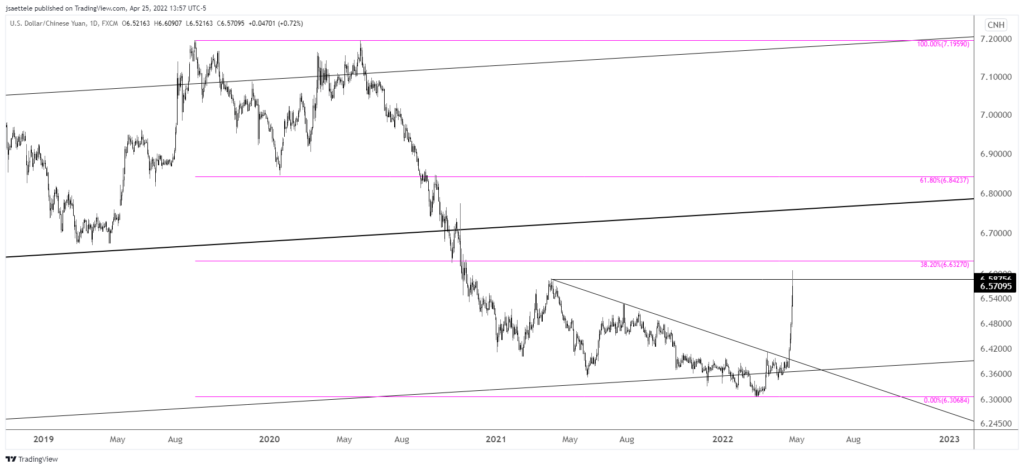
USDCNH was the ‘tell’ when it came to additional USD strength. Now that USDCNH has taken out the April 2021 high, I’m wondering if price retraces a portion of this advance and/or falls back into a range. The 38.2% of the decline from the 2019 high is just above as well. USDCNH is important in the sense that the USD in general isn’t going to reverse lower as long as this holds up. This is especially true against commodity FX specifically and risk sentiment generally. Note how Aussie, Kiwi, and CAD were slammed during this USDCNH rally.
4/19 – USDCNH broke above a year long trendline today and price also completed a 4 month head and shoulders pattern today. Watch the top side of the blue trendline for support near 6.3930. I realize that this goes against the idea of the USD topping. Maybe the USD has more to go that previously thought?
USDSEK DAILY
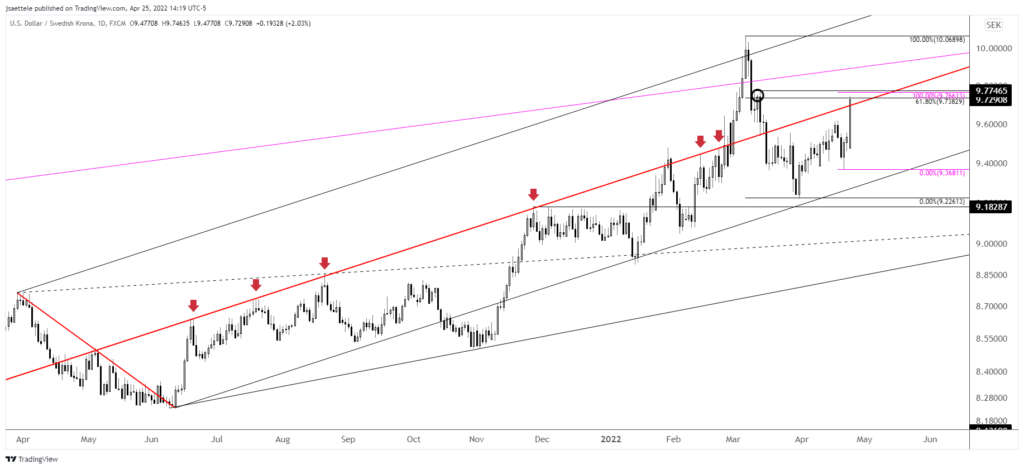
USDSEK has surged into the 61.8% retrace of the decline from the March high. 2 equal legs up from the low is just above along with daily highs from March. I’m on alert for a reversal lower. Recall that USDSEK tends to act as a leader for the USD generally.
GBPUSD DAILY
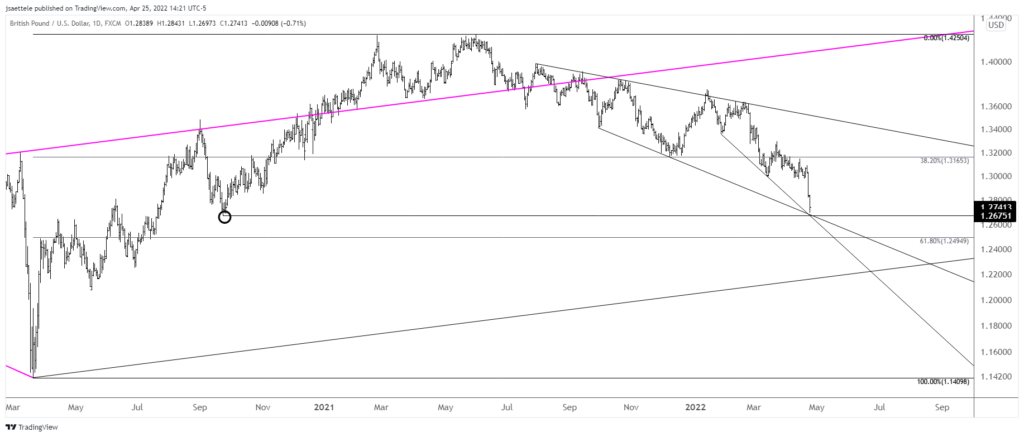
Heads up on 1.2675 in GBPUSD. This is the September 2020 low and a confluence of downward sloping trendlines that connect lows in 2021 and 2022.
AUDUSD DAILY
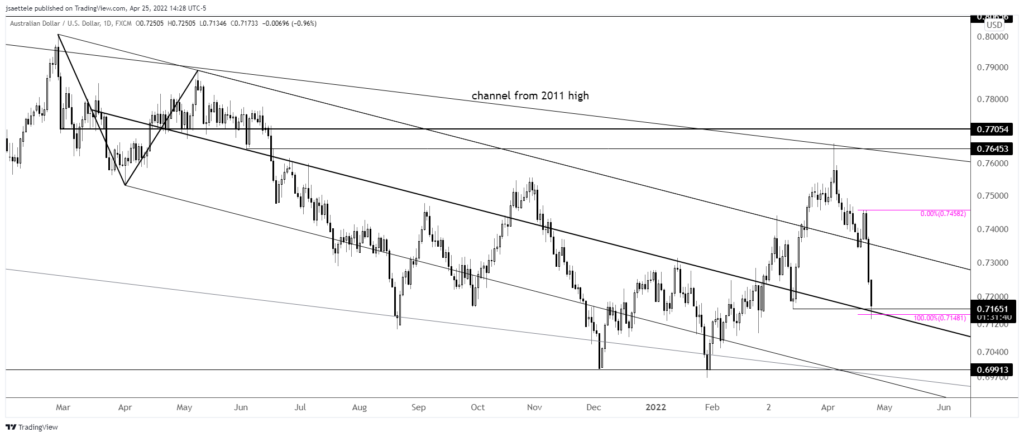
Aussie price action has been brutal. After breaking above year long trendline resistance, price was slammed for 3 days without any reprieve. I’m thinking bounce here given the presence of the channel center line, 2 legs down from the April high, and the 3/15 low. Look towards .7250/80 initially.

