Market Update 4/13 – USD Topped Today
DXY DAILY
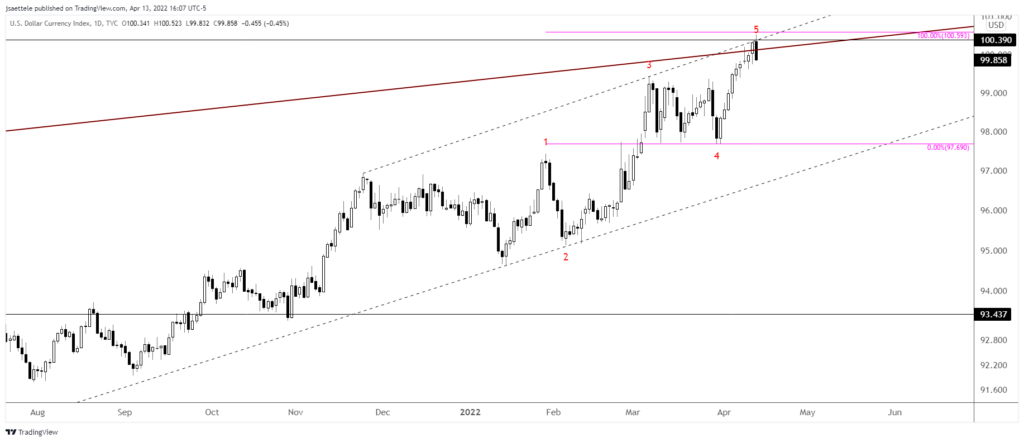
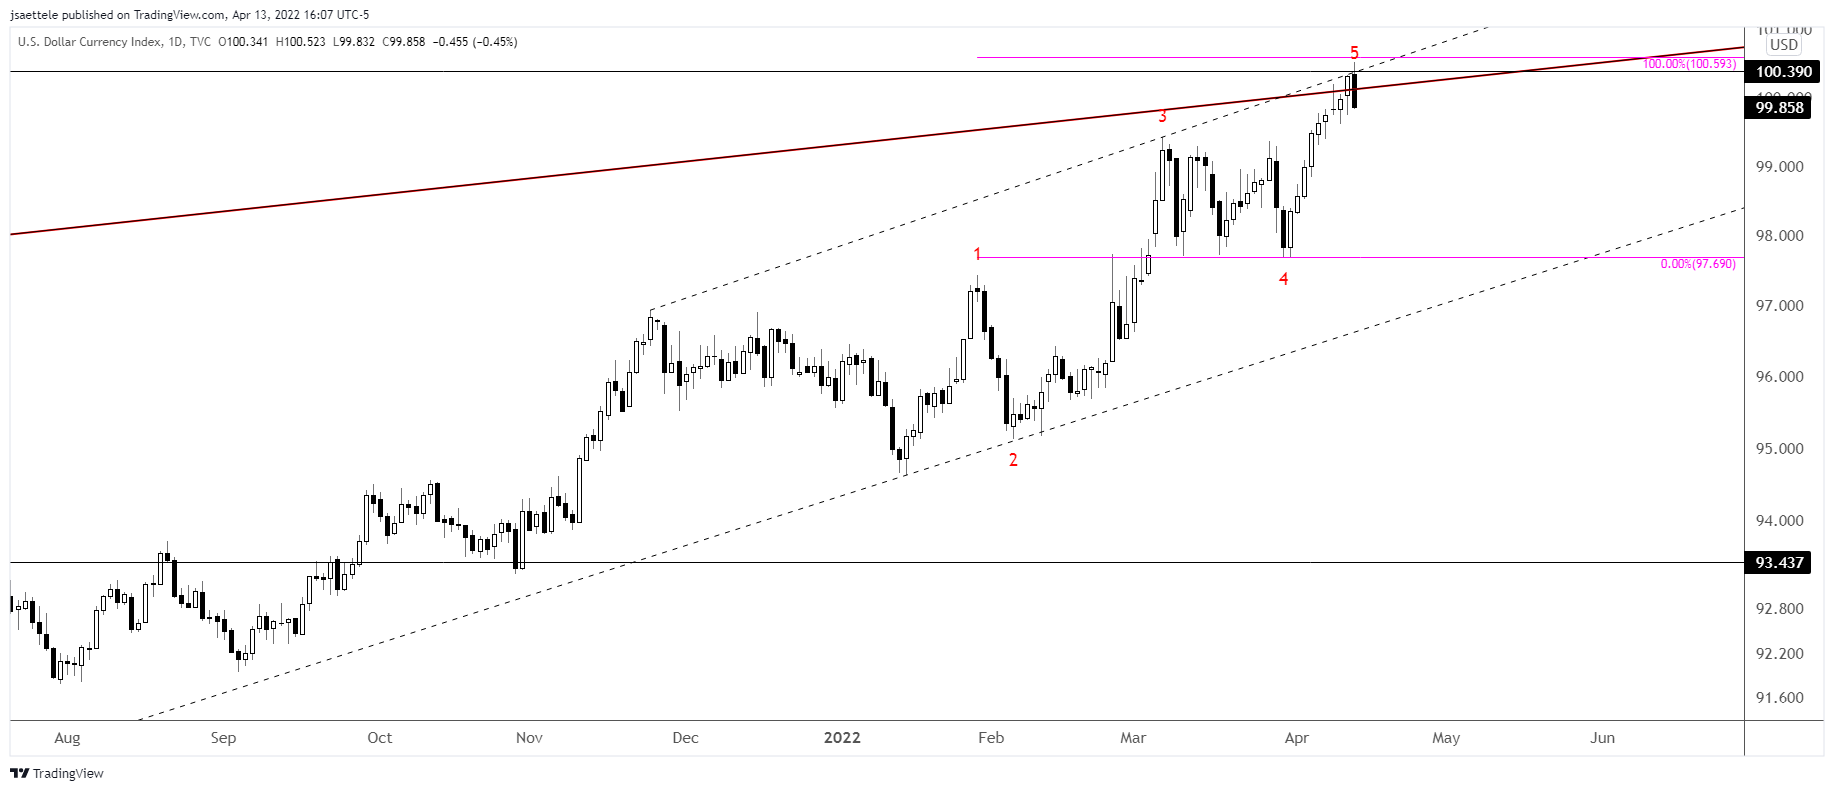
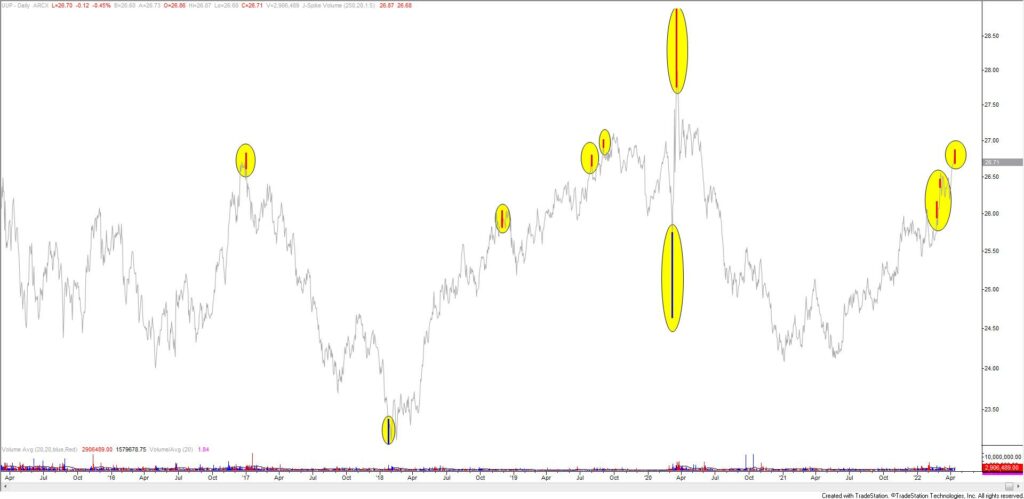
DXY printed 100.52 today and then carved a key reversal. In fact, UUP (USD ETF) made a high volume reversal (see below). The combination of the wave count, measured level (recall the 100.59 measurement), upper channel line, and volume reversal make a strong case that the USD topped today.
4/12 – DXY has reached the bottom of the zone cited last week for possible resistance. The line off of the November 2021 and March highs is right up here along with the well-defined horizontal that goes back to 2015. Within the sequence from the January low, wave 5 would equal wave 1 slightly higher at 100.59. Also, DXY is now up 9 days in a row (see below). The last time that happened was at the March 2020 high!
UUP DAILY
EURUSD 4 HOUR
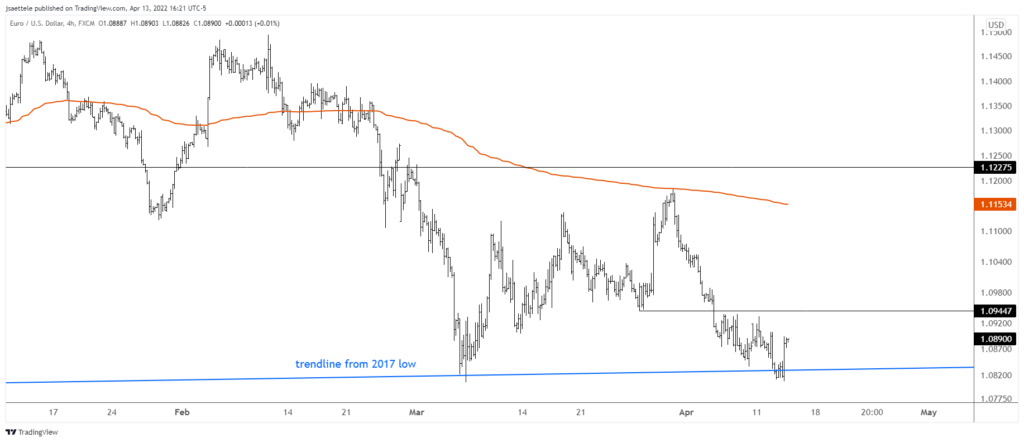
Don’t forget that EURUSD is STILL on the trendline from the 2017 low! There isn’t anything to add to the longer term ‘idea’ that wave D of a long term triangle is bottoming now other than noting that I’ll look to trade on the long side if price takes out 1.0940s. This level has been support/resistance since late March. In other words, treat it as the bull/bear dividing line.
4/7 – This is from the Long Term update earlier today. “Everything since the 2017 low may be a triangle in which case EURUSD is probably completing wave D now. The implication is that price turns up in an E wave and rallies back to 1.1850 or so.” The lower trendline is about 1.0835.
Do you make a profit trading EUR/USD?
Try our funded trader program and get up to $1,000,000 in funding.
Learn more
BRITISH POUND FUTURES DAILY
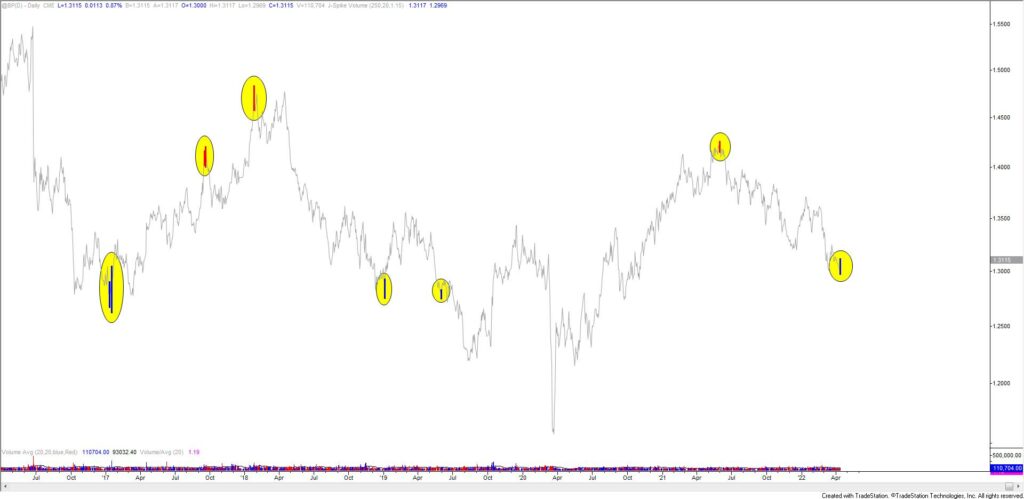
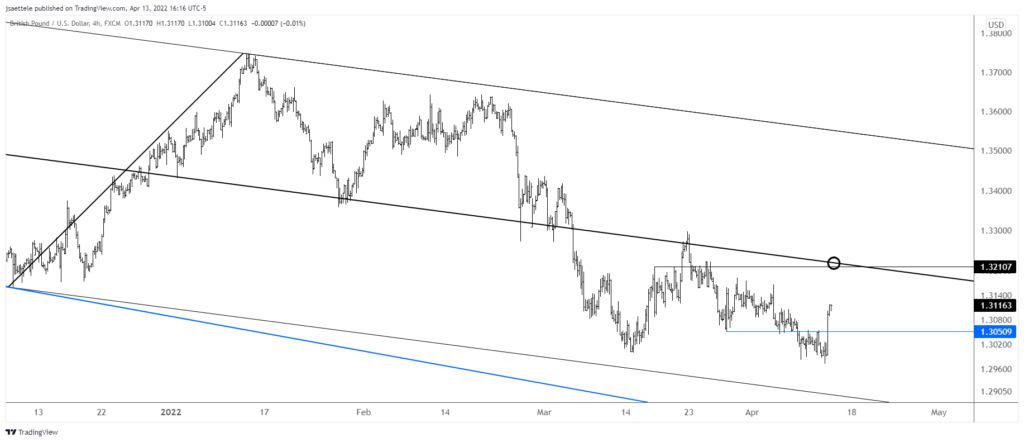
Cable also made a high volume reversal today. This chart shows all such reversals over the last 7 years. Not bad! 1.3050s should provide support now (see below) and 1.3210 or so is a near term level of focus on the upside.
GBPUSD 4 HOUR
USDCAD 4 HOUR
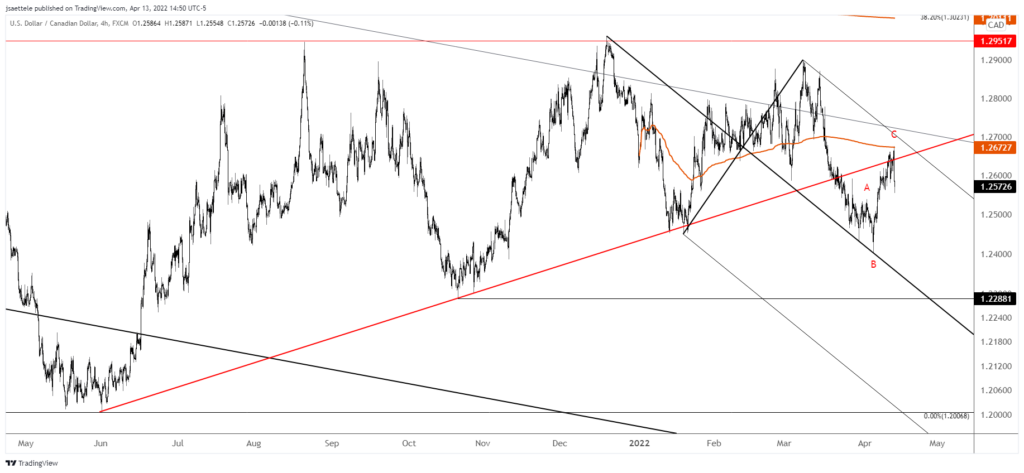
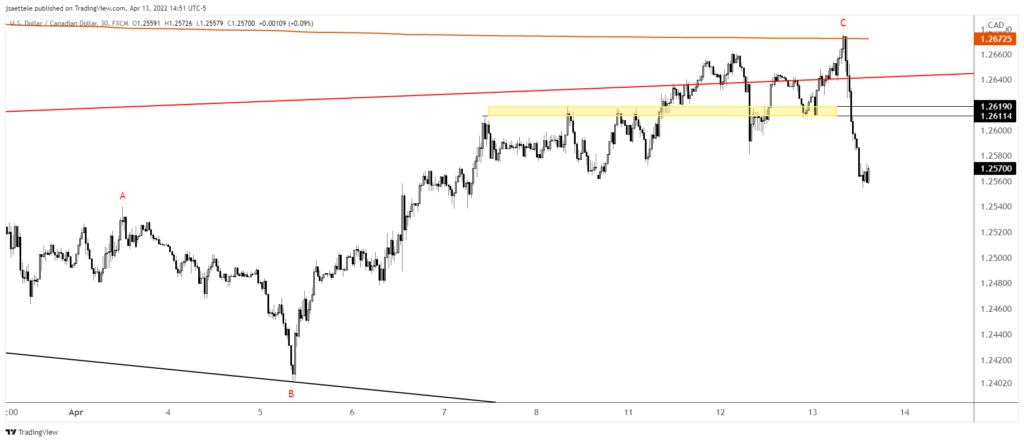
USDCAD traded around the underside of the trendline from the 2021 low for 3 days before finally reversing lower today after BoC. The bearish outside day today strongly suggests that a tradeable high is in place. Proposed resistance is 1.2610/20 (see short term chart below). The next downside level of interest is the month open and 61.8% retrace at 1.2507. I remain of the mind that a flat completed from the 3/30 low which means that I’m looking for an eventual break below the April low.
4/11 – USDCAD has reached the level noted for resistance. This level is huge. It’s defined by VWAP from the March high, 200 period average on the 4 hour chart, underside of the trendline from the 2021 low, and year open! My ‘guess’ is that price rolls over but I need a response, such as a price and/or volume reversal, in order to short. Stay tuned.
USDCAD 30 MINUTE
