
Market Update 4/12 – DXY 9 Days Up!
DXY DAILY
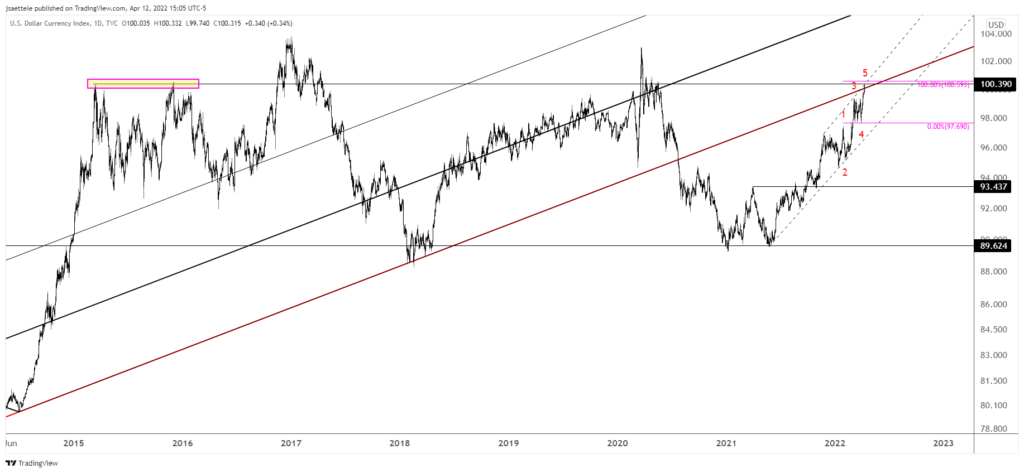
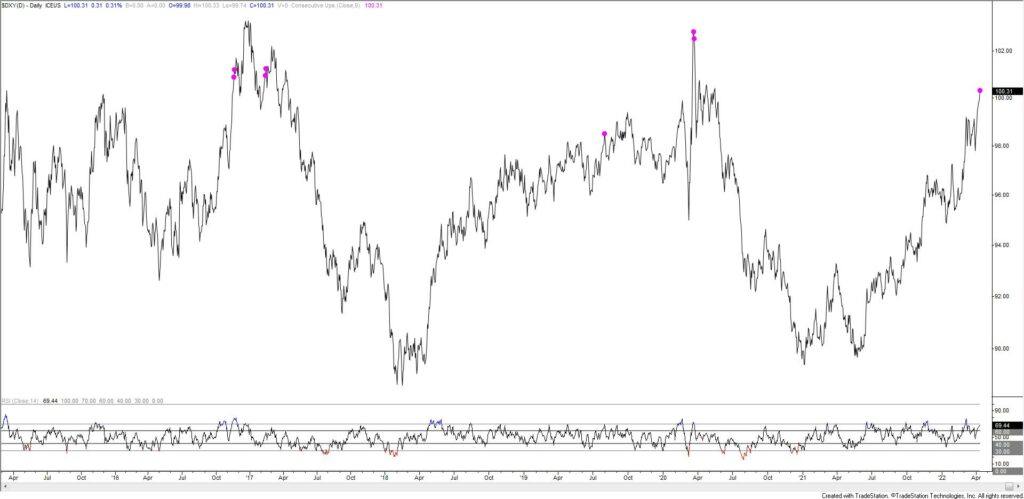
DXY has reached the bottom of the zone cited last week for possible resistance. The line off of the November 2021 and March highs is right up here along with the well-defined horizontal that goes back to 2015. Within the sequence from the January low, wave 5 would equal wave 1 slightly higher at 100.59. Also, DXY is now up 9 days in a row (see below). The last time that happened was at the March 2020 high!
4/7 – The ‘final leg higher’ option is unfolding in DXY. A key zone to pay attention to is 100.39/59. This is a well-defined horiztonal and where wave 5 would equal wave 1 within the sequence from the January low. Also, note that EURUSD has yet to trade beneath its March low. It may very well do so but a non-confirmation is in place until that happens.
Do you make a profit trading DXY?
Try our funded trader program and get up to $1,000,000 in funding.
Learn more
DXY DAILY
USDOLLAR DAILY
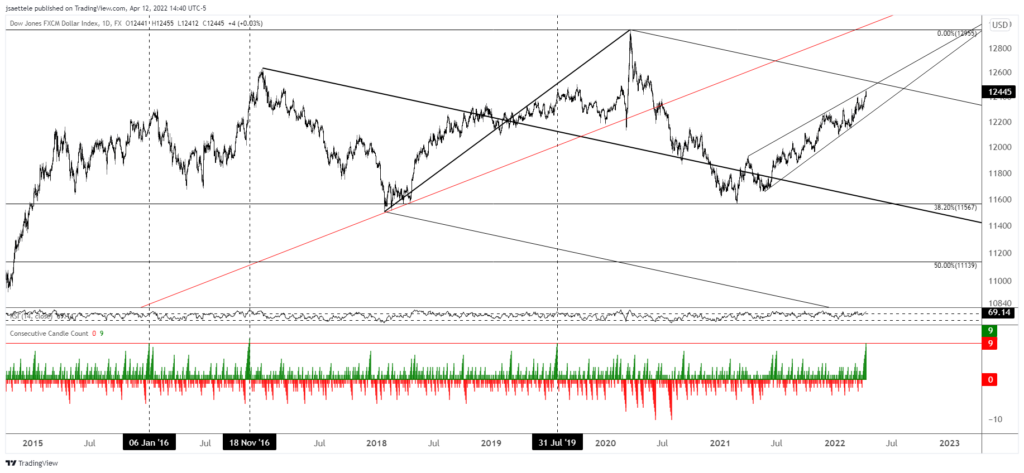
We haven’t looked at this one in a while but USDOLLAR is pressing against the year long upper wedge resistance. In fact, the upper wedge line originates at the April 2021 high. If there is an ’emotional’ blow-off move then price could test the upper parallel from the long term pitchfork near 12534. Like DXY, USDOLLAR is also up 9 days in a row.
USDSEK 4 HOUR
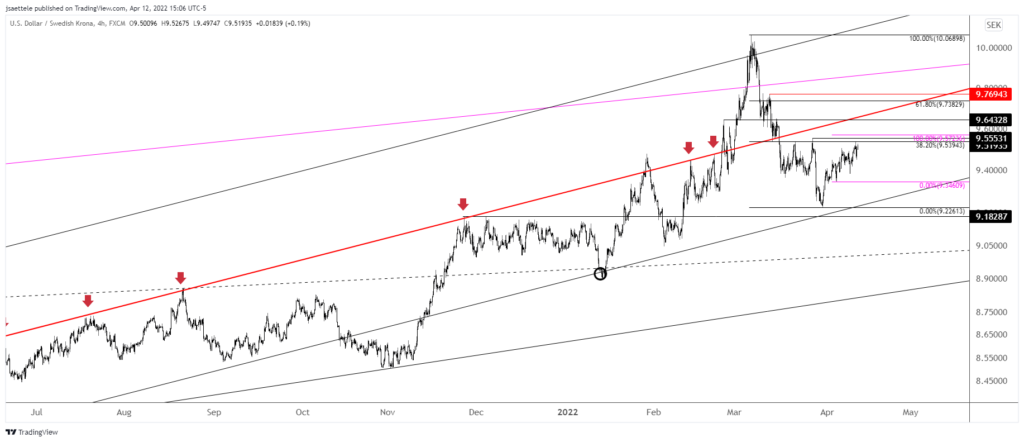
USDSEK has reached the bottom of the noted zone for resistance at 9.54. The median line (red line) that has been resistance multiple times over the last year is now near 9.65. That would be a big move from here but until we see evidence of a turn a move to that level shouldn’t be discounted.
4/7 – The median line (red line) remains key for resistance. That line is about 9.64 now. However, also pay attention to 9.54/57. This zone is defined by the 38.2% retrace of the decline from the March high, 3/28 high, and 2 equal legs up from the March low. Again, I think that USDSEK holds the key to when the USD starts to broadly decline (notably EURUSD advance).
AUDUSD 4 HOUR
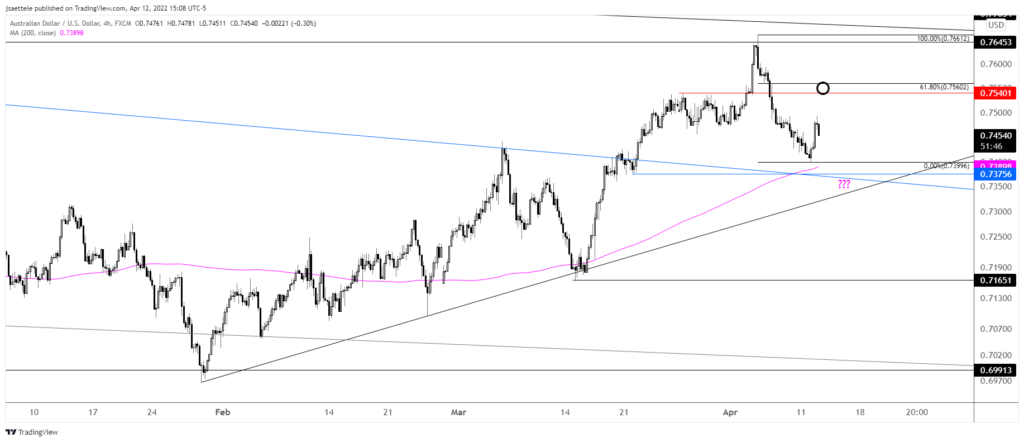
Aussie put in a bullish outside day today, which is kind of annoying because price didn’t yet reach proposed support near .7375. In any case, continue to pay attention to that level for support but also be aware of .7540/60 for resistance.
4/11 – AUDUSD has remained heavy with absolutely no bounces since topping after RBA last week. .7375 remains ideal support from the 3/21 and 3/22 lows and the top side of the trendline from the 2021 high. The coming recovery may only be corrective because the decline is impulsive. .7540/50 sticks out as eventual resistance.
NZDUSD 4 HOUR
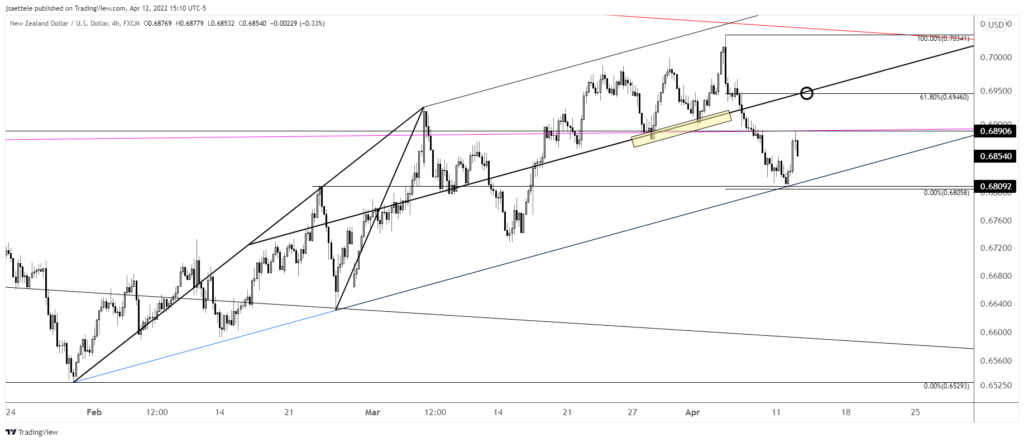
NZDUSD turned up right at channel support, also putting in a bullish outside day. As such, I ‘like’ Kiwi higher from here but be aware of .6940s resistance. .6943 is daily reversal resistance and .6946 is the 61.8% retrace. It’s not shown on this chart but the 50 day average is just under today’s low and exhibits positive slope. This average has been a decent trend filter in recent months (resistance in January and support in March).


