Market Update – August 27
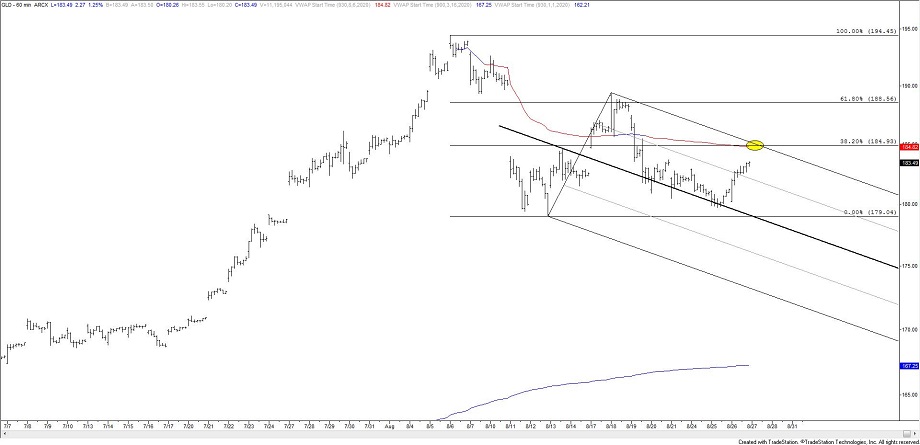
GLD HOURLY
Since the 8/6 high in gold, I’ve been closely tracking GLD. The rally from 8/12 found resistance at the 61.8% retrace and a short term bearish channel is confirmed following the median line touch. If GLD has turned lower, then resistance should be 185.00 (38.2% retrace and VWAP from the high).
8/16 – High so far for gold futures is 2089.2….close enough to the 2095 measurement to think that an important top is in place. Near term, proposed resistance for spot is 1987-1994. Also, a strong of 9 consecutive up weeks ended last week. The only other time that has happened in GLD was May 2006 (see below). That led to a nearly 24% drop. The near term GLD wave count is especially clear (2 charts down). The decline is impulsive (5 waves) so expectations are that the rally proves corrective. Levels to keep in mind for resistance in GLD are 185.50ish (VWAP from the high) and 188.56 (61.8%).
COPPER WEEKLY

Keep an eye on copper, which spiked through the line off of the 2011 and 2018 highs last week before fading lower. Not coincidentally, AUDUSD is also testing the line off of its 2011 and 2018 highs (see below). Bottom line, add copper to the list of assets at major decision points into Jackson Hole.
AUDUSD WEEKLY

AUDUSD has been trading on long term channel resistance for 5 weeks. If the sideways trade is going to resolve to the downside (not withstanding a spike and reversal) then price needs to turn down right now. This is the center line of the channel from the 6/15 low, which has been support and resistance for nearly 2 months (see below). If price does spike higher, then pay attention to the upper parallel near .7350. The breakdown level is .7135.
8/24 – Australian Dollar futures also failed at the 8/19 high volume level today. The spot chart (see below) shows that today’s high also tagged channel resistance from the 2011 high. Final touch before a breakdown? The short term lower channel line, just above the 8/12 low at .7109, is the breakdown trigger. Initial downside focus on a break is VWAP from the June low and former resistance near .7040. Looking out further, .6680 (see below) or so is a downside level to know. This is a clear horiztonal pivot and top side of the trendline from the 2018 high.
AUDUSD 4 HOUR

USDOLLAR 4 HOUR

Generally speaking, it’s been ‘hurry up and wait’ for resolution in the USD over the last 5 weeks. If USDOLLAR is carving a bottom then the center line of the Schiff fork from the March high should provide support near 11967.
8/19 – USDOLLAR dipped under the 8/2 low today and reversed sharply. Today was a bullish outside day, just like 8/2 (close up chart below). I view today as a re-test / fake-out and still favor upside with the previously mentioned 12350 or so as ‘swing’ upside to target. Near term, the March low at 12129 is a possible reaction level.
USDSEK 4 HOUR

Different symbol, same story. If USDSEK action through August is a bottoming pattern then price needs to turn up here. Above 8.8150 would confirm that a low is in place. Again, price has been trading along the full extension of the channel from the 2018 low and the lower parallel of the channel from the March high. Great place for a low.
8/19 – USDSEK undercut the 7/31 low on 8/6 and again this week before turning up today. My view, that 5 waves down from the March high, are complete has not changed. A commensurate corrective advance towards the former 4th wave high at 9.4799 is favored.


