Market Update: April 13
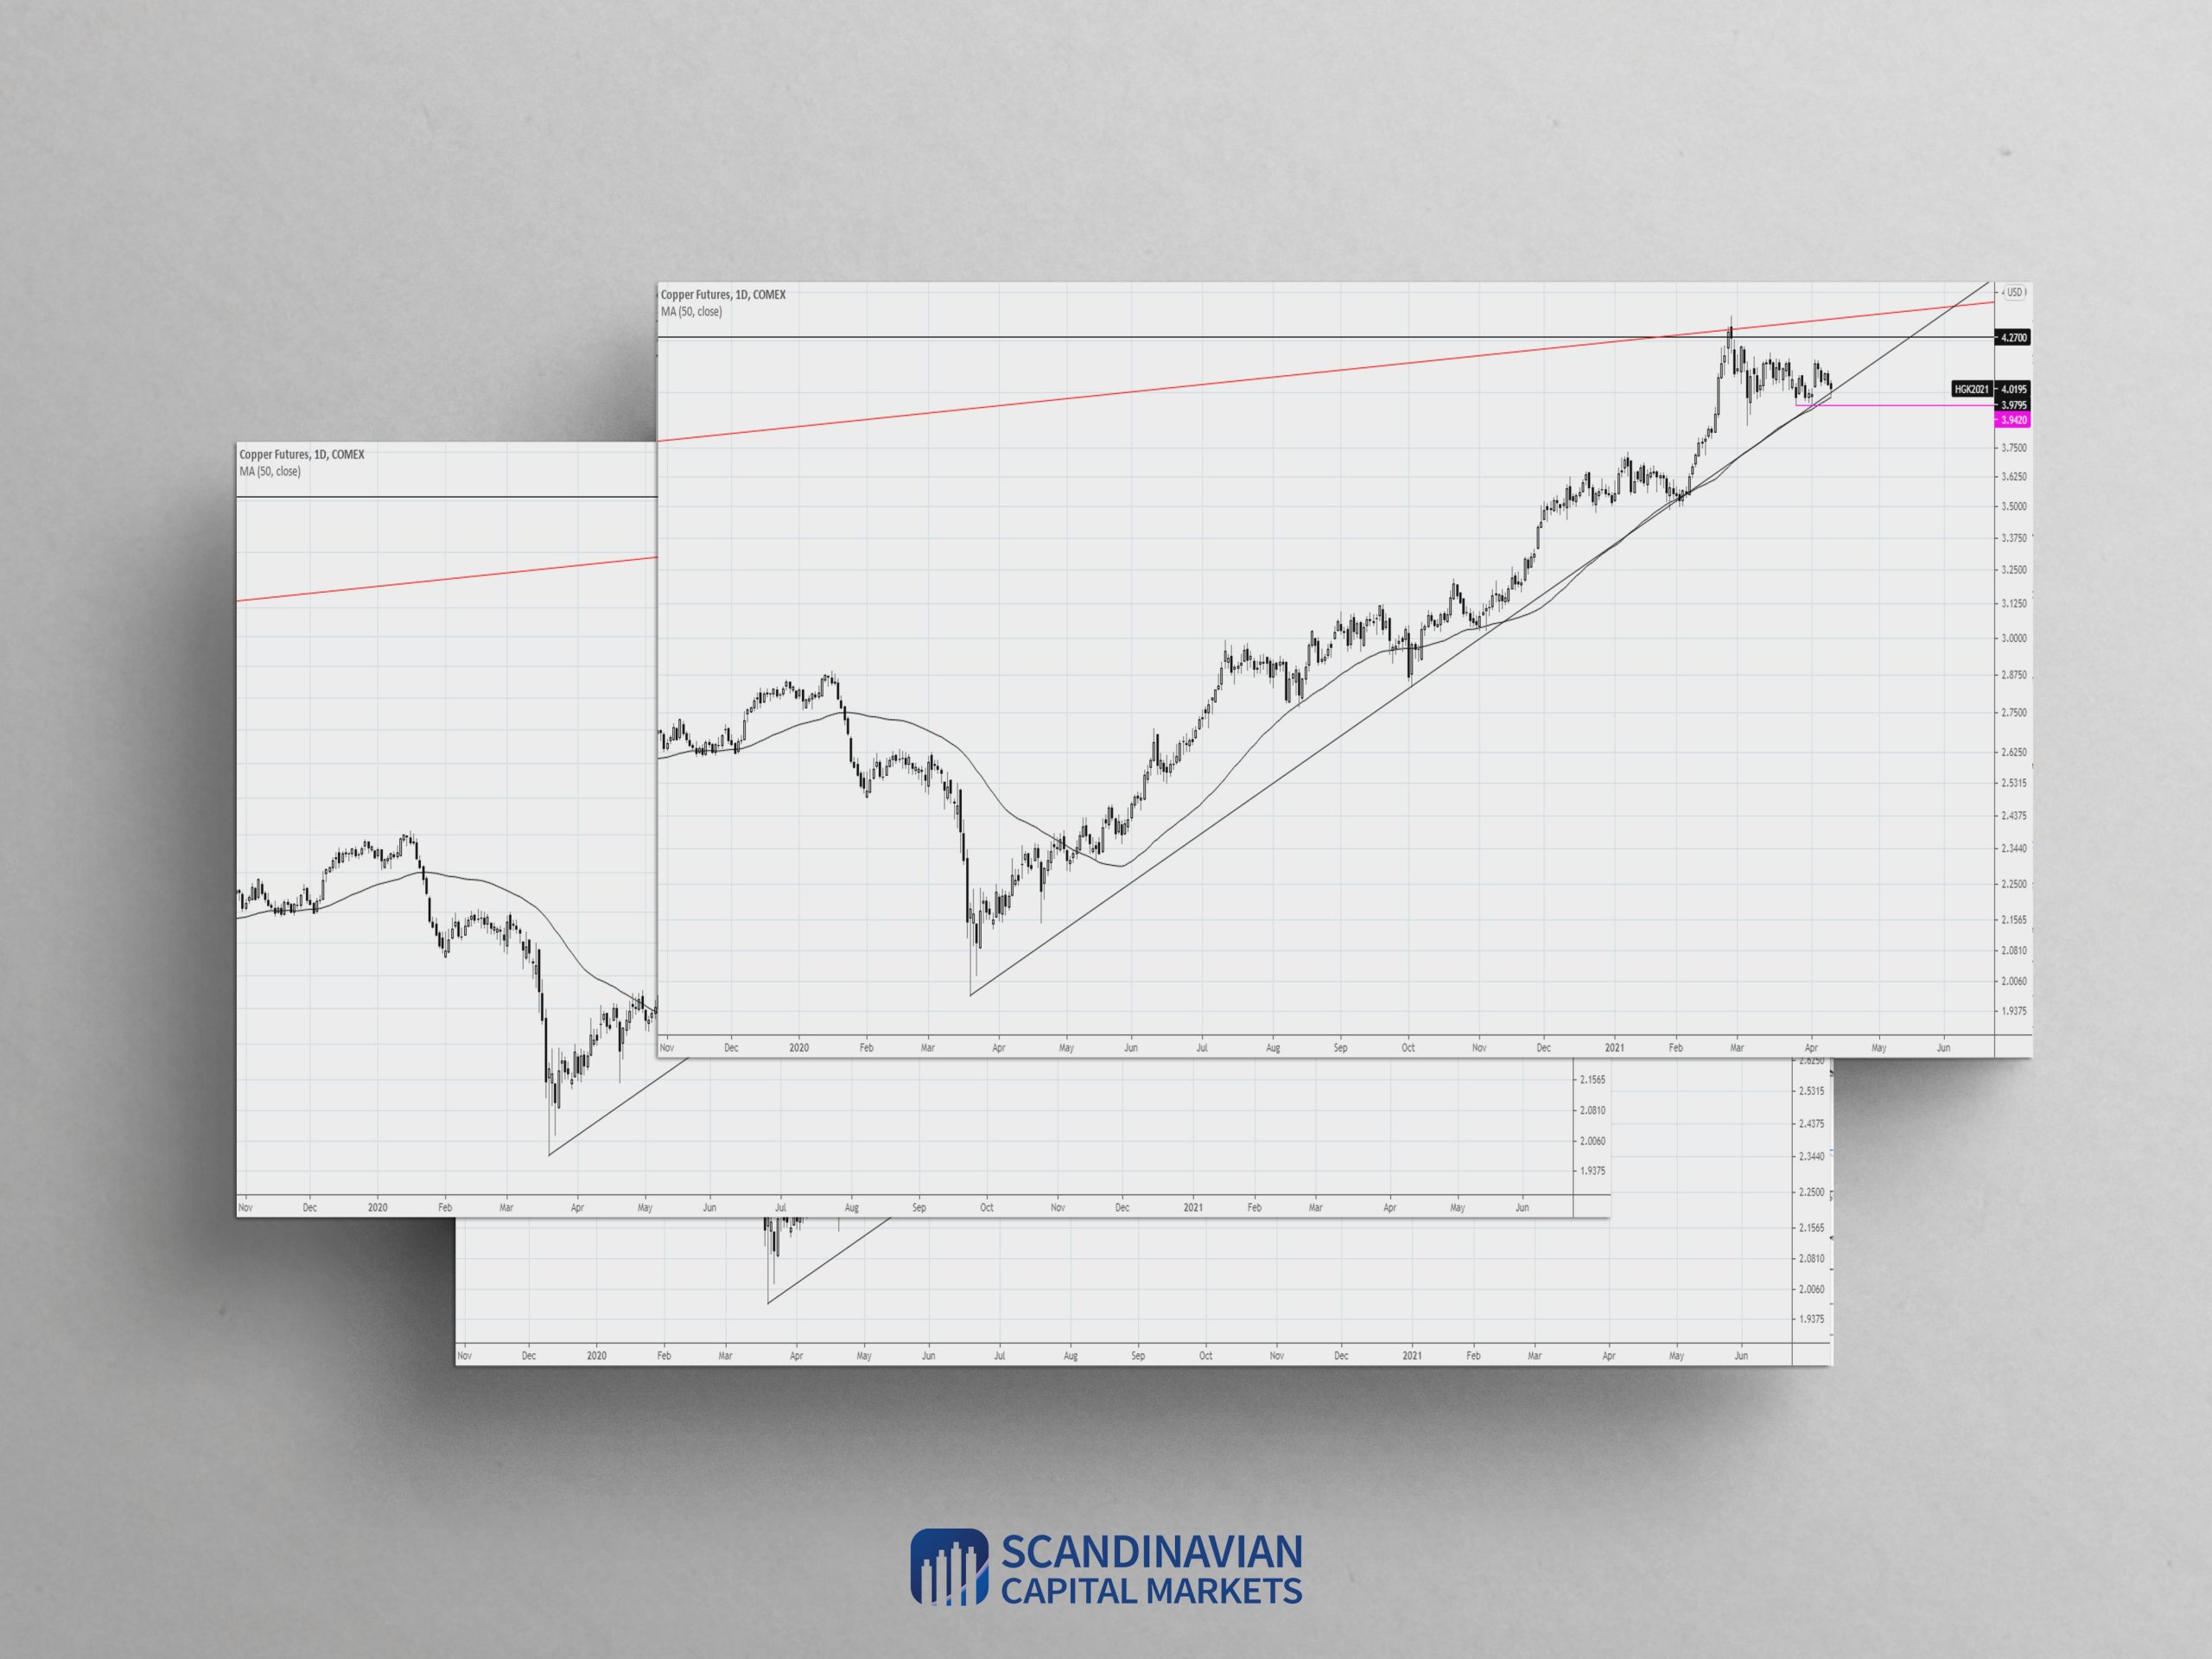
Market Update 4/12 – Key Spot in Copper
April 13, 2021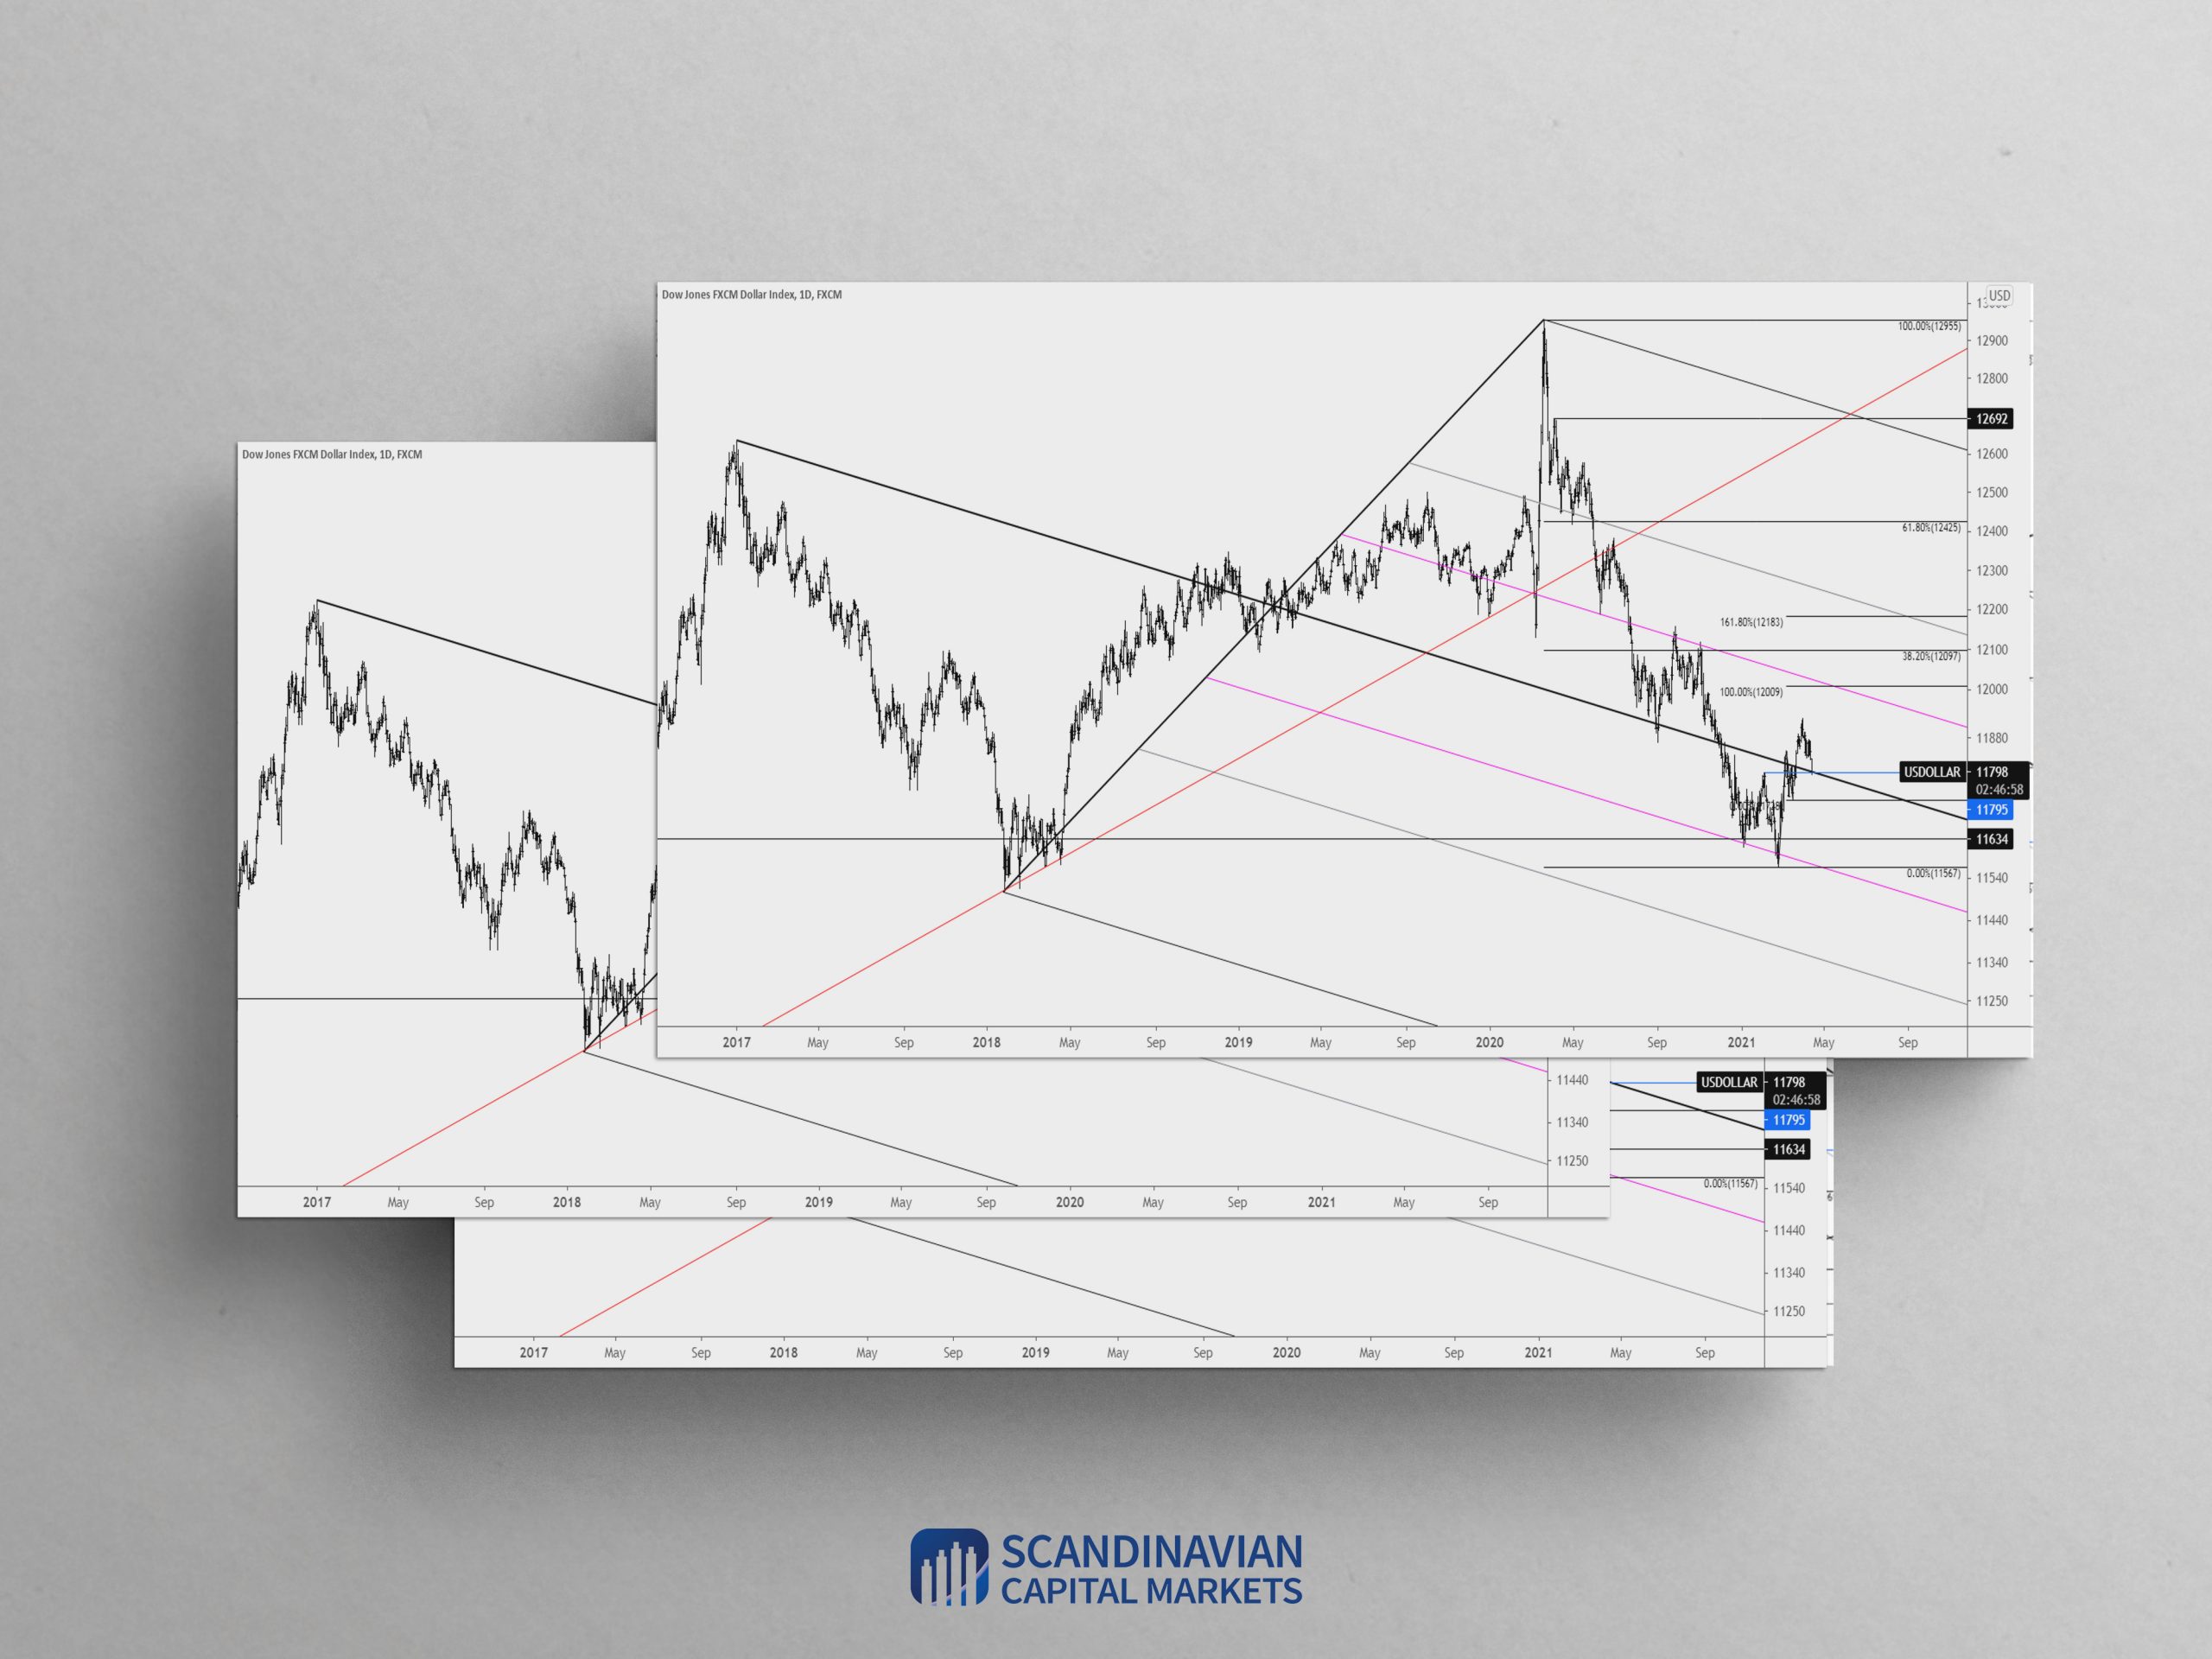
Market Update 4/14 – Key Level for the USD
April 15, 2021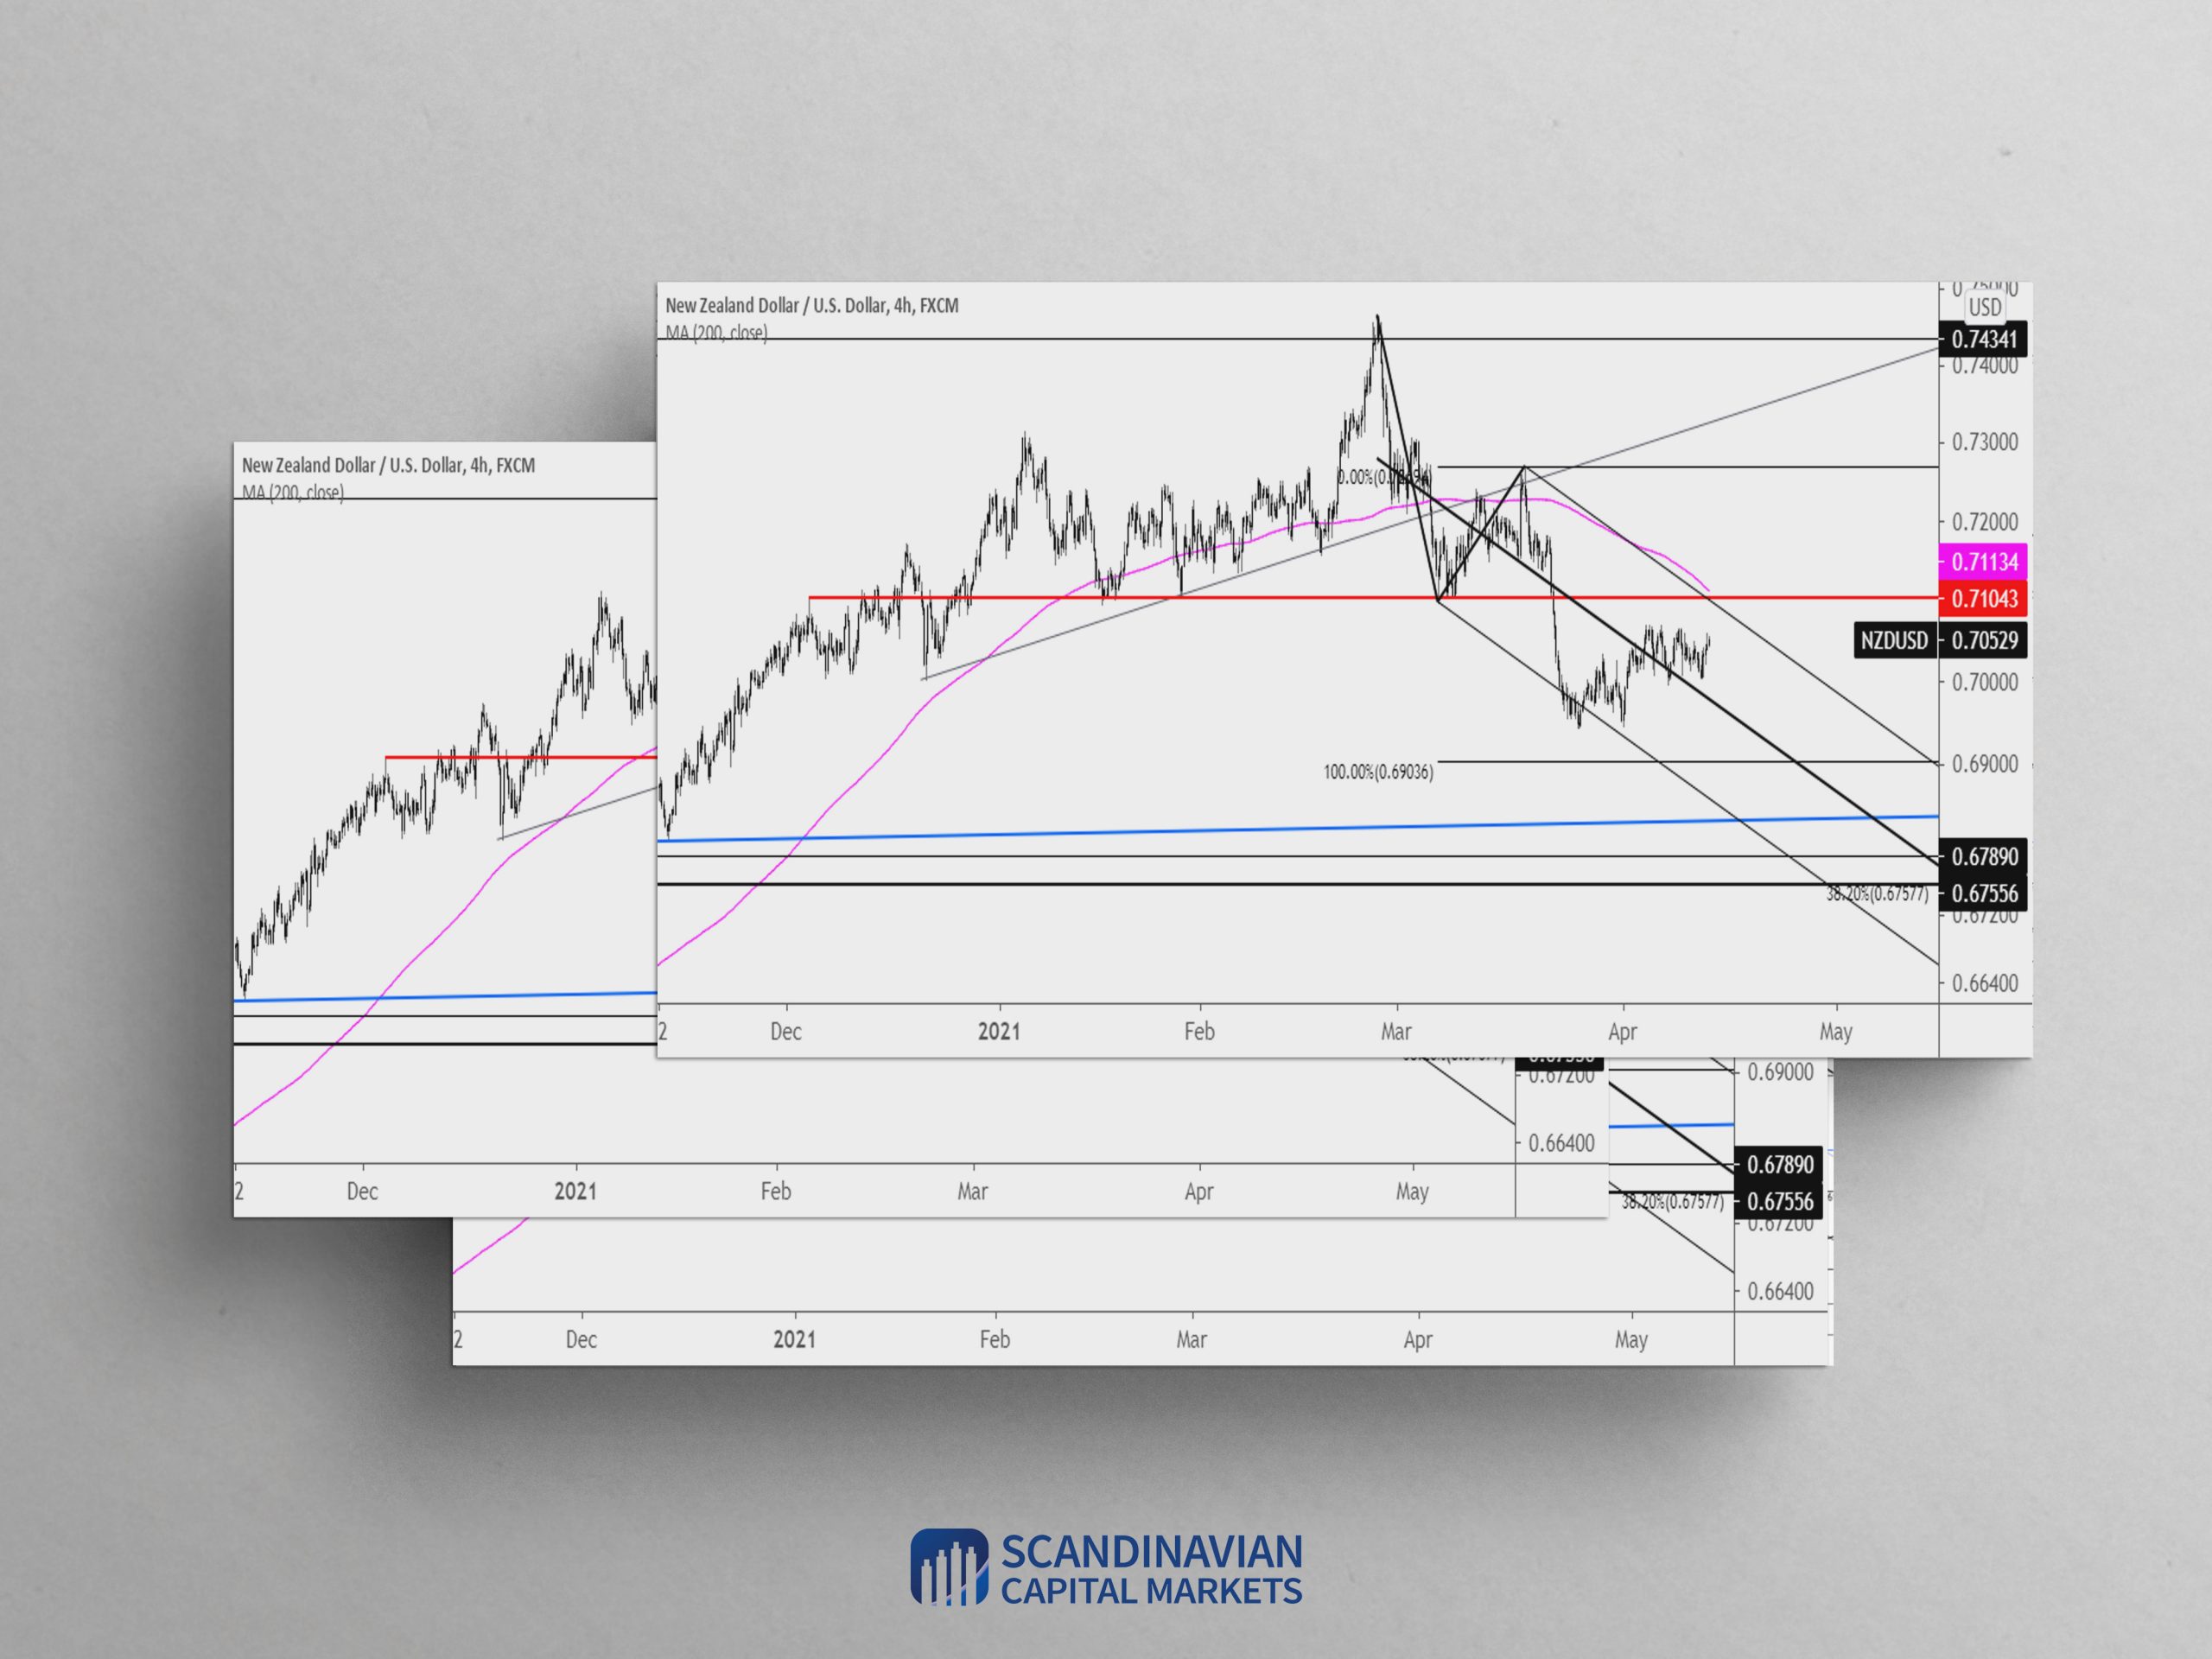
Minimal Clean Multiple Landing Page Website Psd Mockup
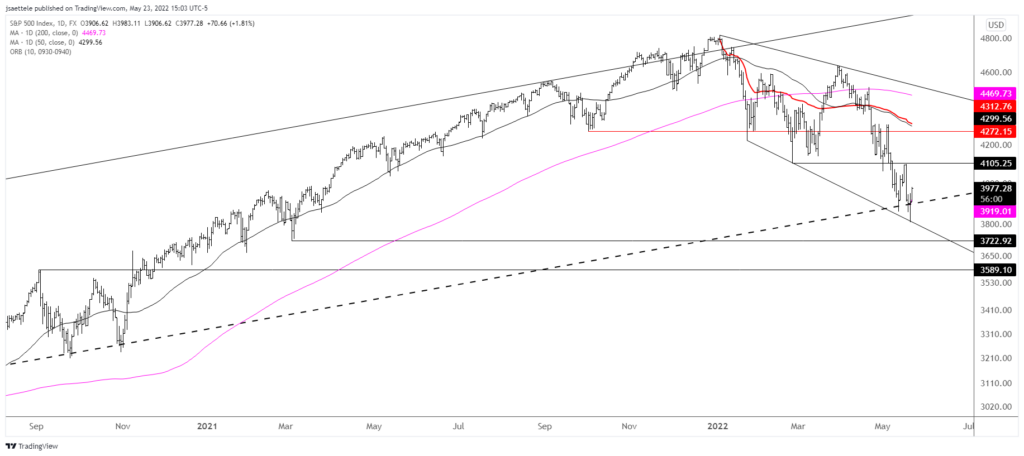
S&P 500 FUTURES (ES) DAILY
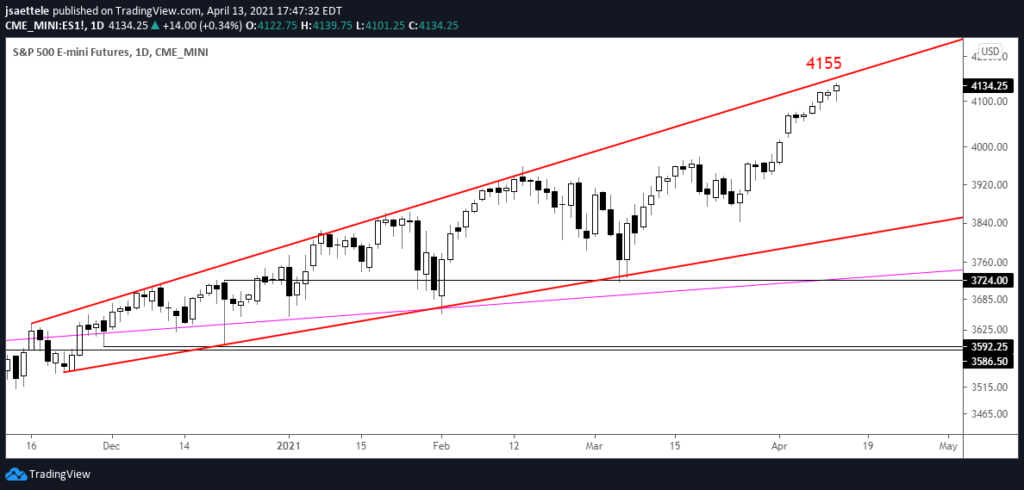
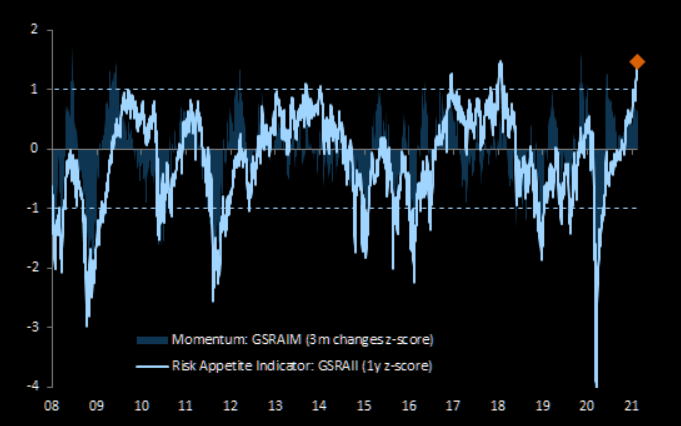
The line that extends off of highs since November is about 4155 now. KNOW IT. The Goldman risk appetite index just printed a record high (see below). ‘But protection when you can, not when you have to’ goes the saying.
4/8 – Pay attention to ES at 4140s. This is the line that extends off of highs since November. That simple. Also, bearish sentiment has printed a post-Corona low (see below). Viewed in this light, there aren’t any more bears! To quote George Patton’s eloquent quote regarding herd mentality; ““If everyone is thinking alike, then somebody isn’t thinking.”
GS RISK APPETITE INDICATOR
EURUSD HOURLY
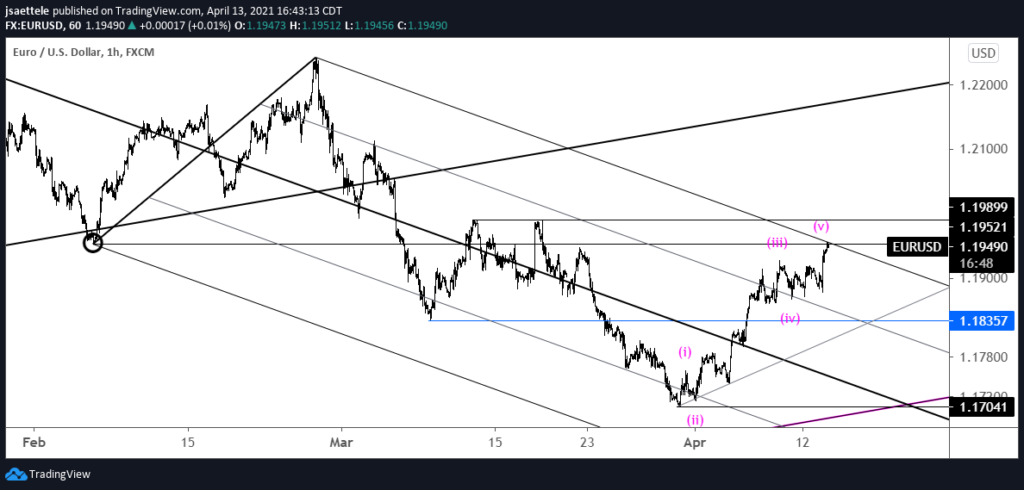
EURUSD is 1.1950 and sports 5 waves up from the late March low. I am looking for a turn lower and corrective drop into 1.1835. Allow for some evidence of resistance but I like the downside up here.
4/13 – EURUSD continues to churn around 1.1915. I’m thinking that price makes a run at 1.1950s, which is the upper parallel from a bearish fork and the 50 day average. A top near there and pullback would make sense because the rally is unfolding in 5 waves (see the 4 hour chart below).
GBPUSD 4 HOUR
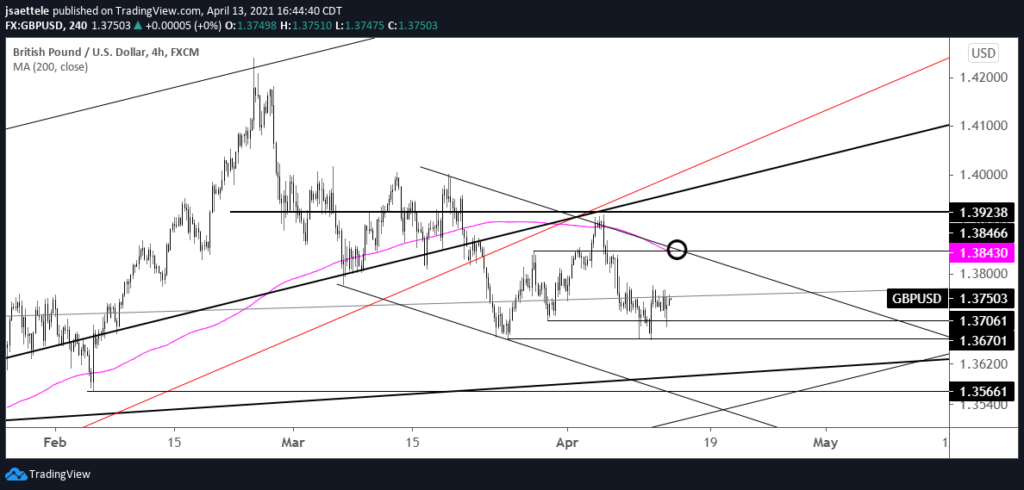
The spike lower and reversal during early U.S. trading keeps yesterday’s ‘idea’ intact. That is, a bounce into 1.3850 or so is in order before GBPUSD resumes lower.
4/12 – I continue to look towards 1.3566 in GBPUSD, but a bounce back to 1.3850 or so may be in order before weakness resumes. Price held the 3/25 low today and turned up sharply. Watch for support near 1.3706.
NZDUSD 4 HOUR
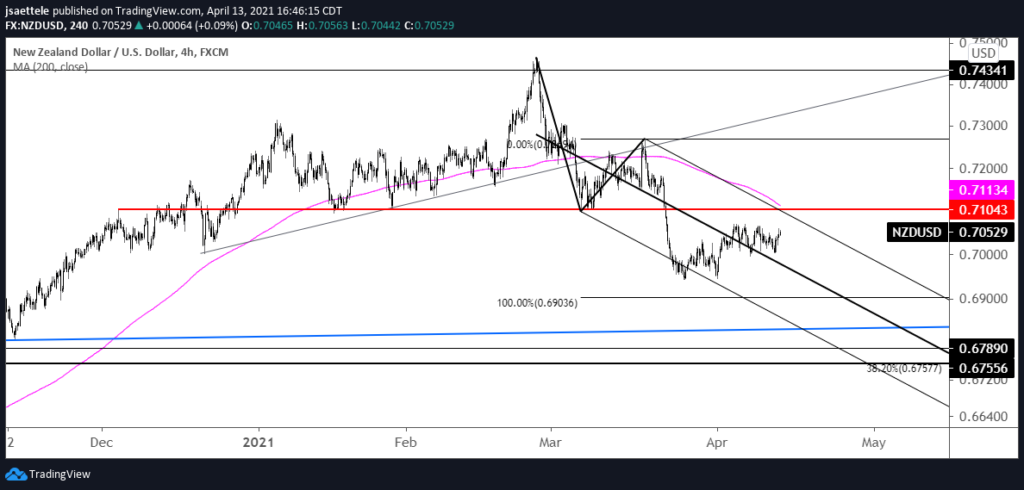
NZDUSD failed to turn lower from the line that extends off of the February and 3/18 highs. The structure from the February high is now a Schiff fork. The upper parallel intersects with the well-defined .7100 level and 200 period average on the 4 hour chart. If NZDUSD is lower, then .7100 is the price to short.
4/12 – Time for NZDUSD downside to resume? Price has traded into channel resistance and the 20 day average continues to hold as resistance. I favor the downside against .7070 with initial downside focus on .6900.