Market Update 8/2 – The Economist Cover Strikes Again!
THE ECONOMIST
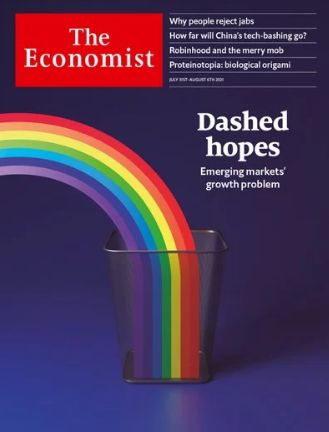
The ‘magazine cover indicator’ strikes again. For a short explanation on the logic applied, check out a post about the U.S. Dollar from 2016.
The most recent Economist cover highlights emerging market struggles. Again, check out the post in the link above for an explanation on why magazine covers are useful contrarian covers but the bottom line here is that EM (I’ll dig into EM equities and FX more in the coming days) is ‘sold out’.
USDTRY DAILY
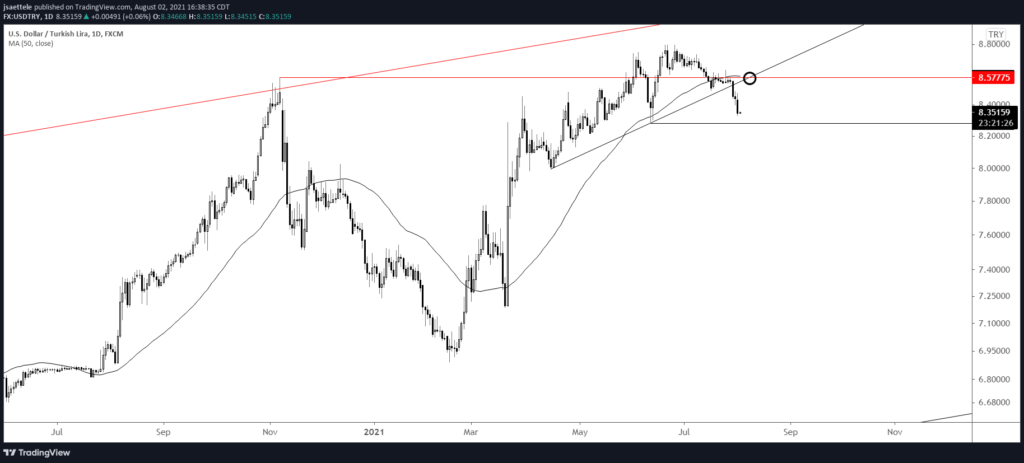
One place to look for EM outperformance in the Turkish Lira. USDTRY has trended higher (higher USD and lower TRY) with little interruption for over a decade. A massive double top is possible given the failed move after posting an all-time high. Proposed resistance for short entry is 8.57-8.58.
BTCUSD DAILY
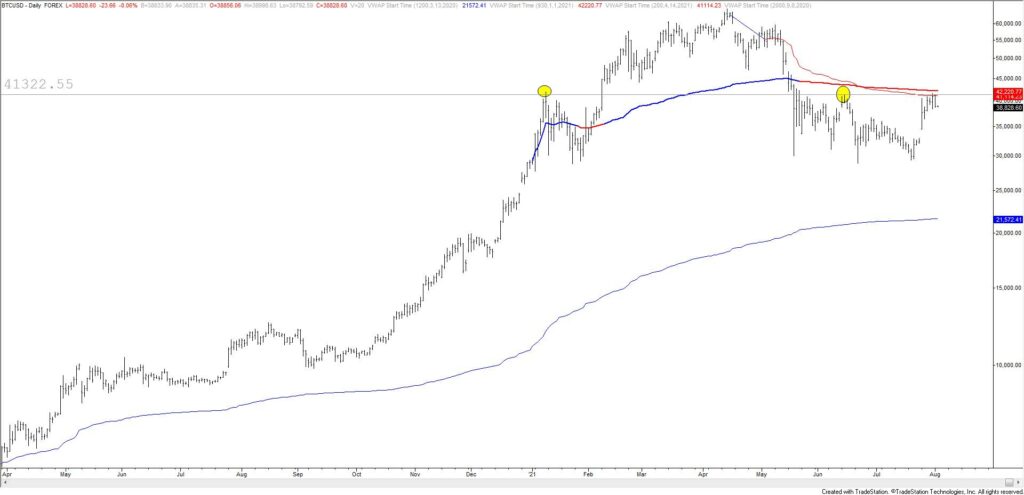
After some back and fill, BTCUSD made the run into 42000 and turned down. That’s exactly what we were looking for! I’m bearish again.
7/26 – BTCUSD traded up to 40593 today. Recall that 42000-44000 was noted as resistance the day of the low (6/22). I’d prefer to see a bit more upside into this zone before turning bearish again but the easy part of the rally is likely complete.
AUDUSD DAILY
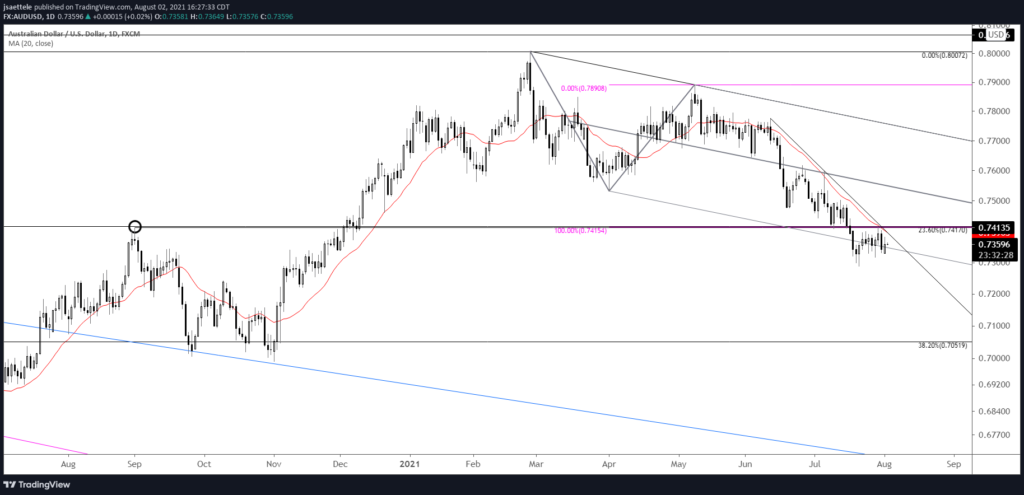
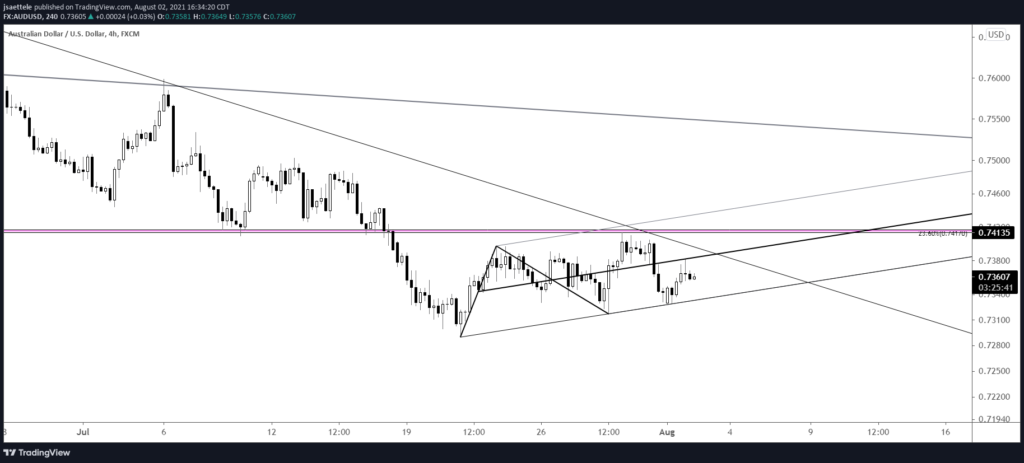
AUDUSD traded up to .7415 on Friday and turned down sharply. As noted last week, the 20 day average logic indicates potential for a strong downtrend. I’ll head into RBA tonight with a bearish view against .7420. Watch for .7380 resistance (see short term channel below).
7/28 – .7415 has been discussed in these pages for months. That level is now reinforced by the 20 day average and a short term trendline. Also, the rally from the low would consist of 2 equal legs at .7427. If a strong downtrend is underway, then .7415/30 (or so) should provide resistance. The chart below shows price with a rolling 20 day midpoint. Notice how the 20 day midpoint acts as support or resistance during strong trends.
AUDUSD 4 HOUR
USDCAD 4 HOUR
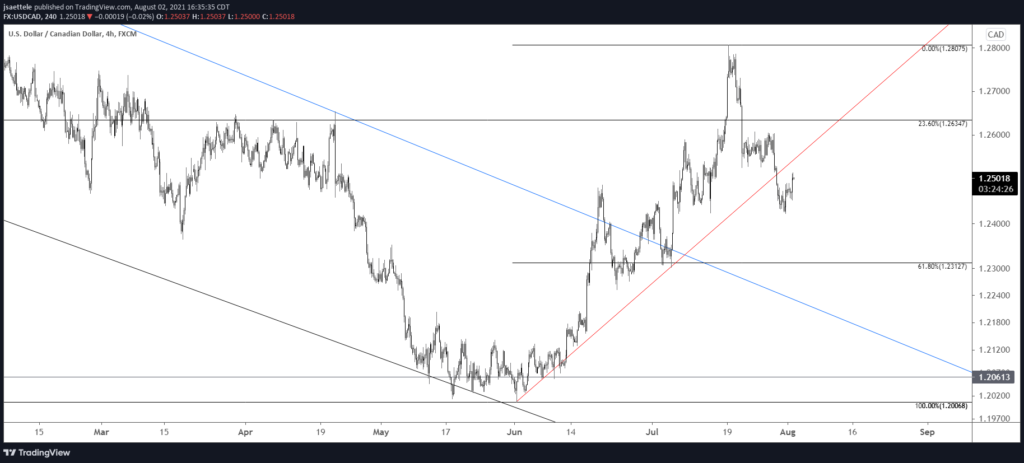
USDCAD has broken near term trendline support. The underside of the trendline is proposed resistance near 1.2550. The most recent high volume level is 1.2530. Bottom line, 1.2530/50 is proposed resistance. Downside focus is 1.2300/13 (former support and the 61.8% retrace).


