Market Update 11/8 – Metals Near Pullback Levels
SPOT GOLD DAILY
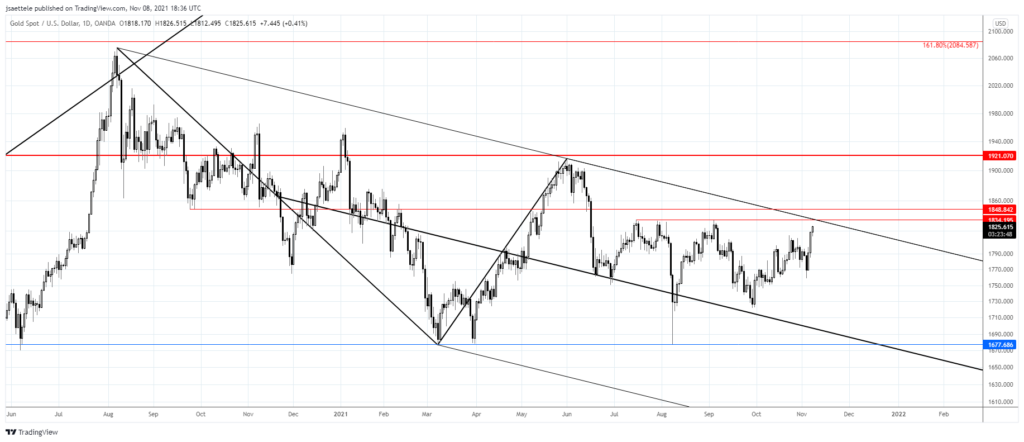
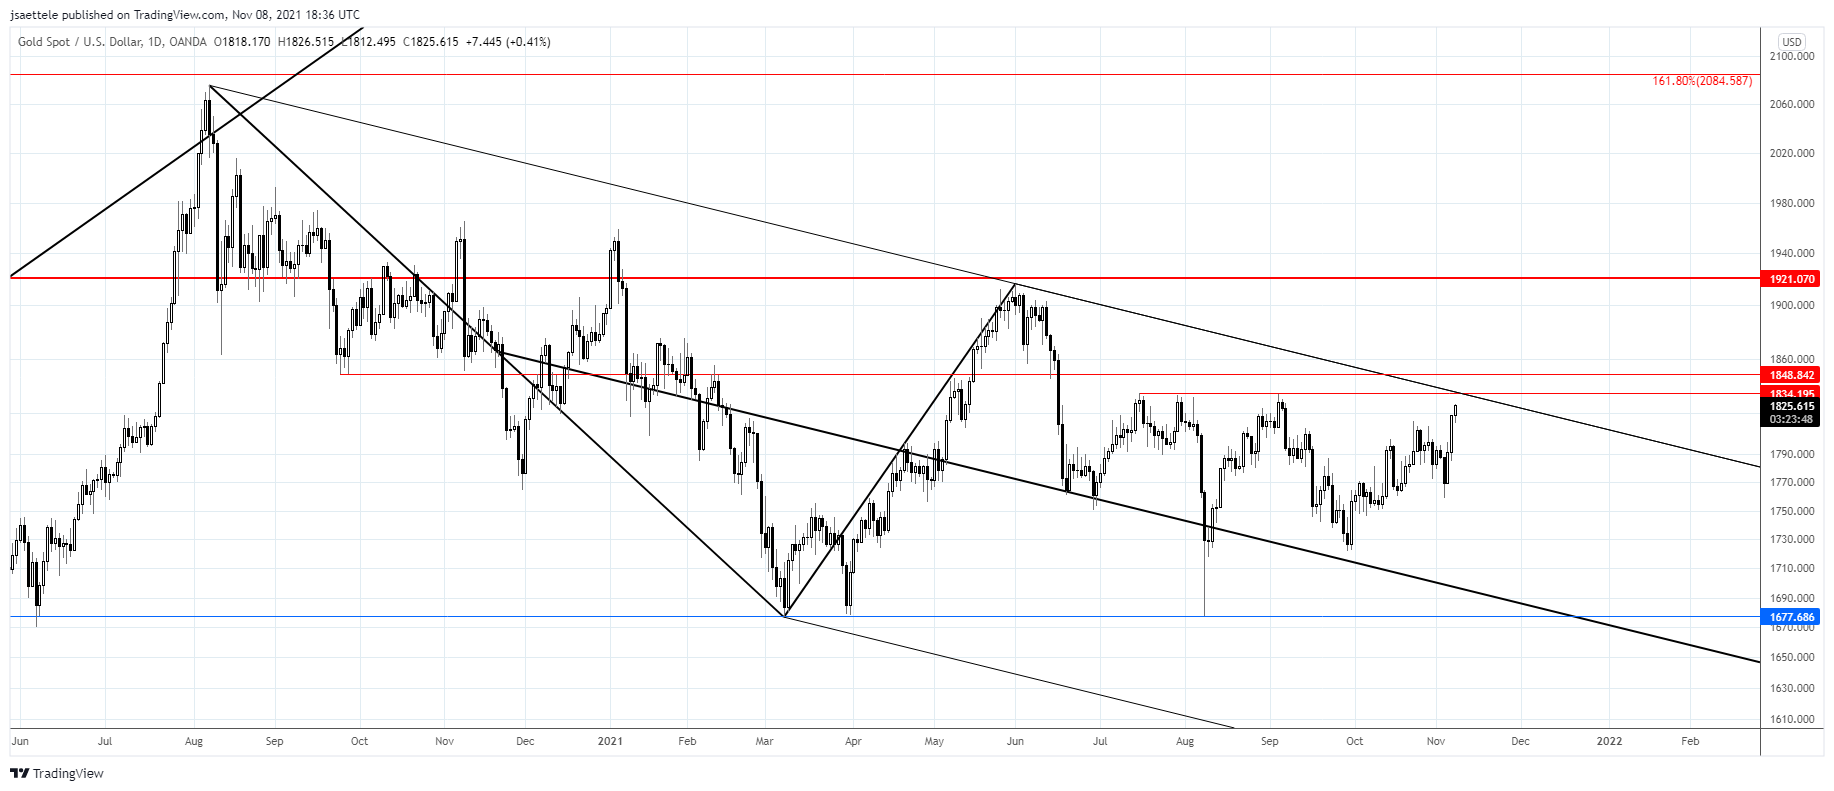
Gold is closing in on the noted level from the line that extends off of the 2020 and May highs and resistance since July near 1834. I’m ‘thinking’ pullback initially from the well-defined level but will be tracking for support beginning near 1800 since I’m of the mind that the broader trend is higher.
10/27 – Gold continues to chop around proposed support (1790). I continue to look towards 1840 or so. In other words, my view hasn’t changed. I’m showing this chart today though in order to highlight the 200 hour average, which has been a superb trend filter for month. If gold is headed higher, then it’s headed higher from the current level (in my opinion).
SPOT SILVER DAILY
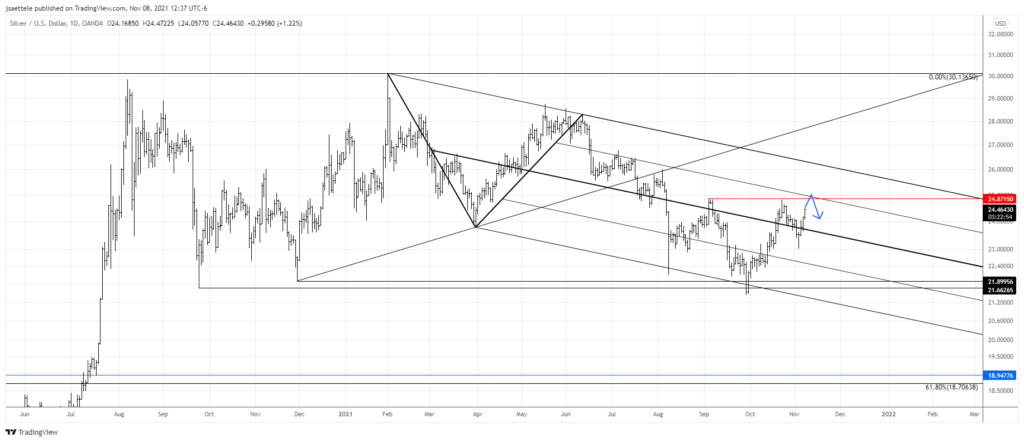
Pay attention to 24.87 or so for silver resistance. The level is defined by highs in September / October and the 25 line within the channel from the February high. Support to align with broad upside is probably back near the median line, which is currently about 23.69.
EURUSD DAILY
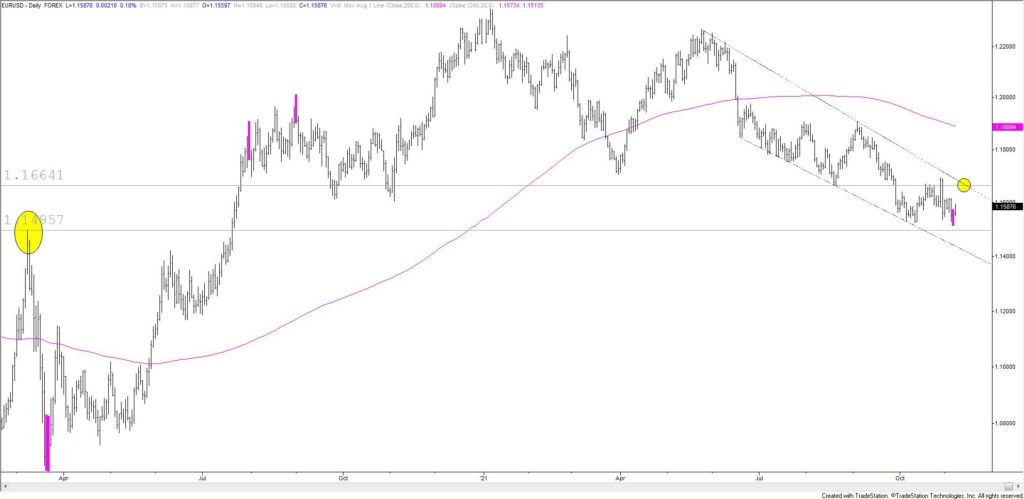
Price action since March 2020 is shown. The magenta bars denote key reversals with a volatility filter. Price followed through on Friday’s reversal, which is a positive. I also like that Friday’s low is just above the March 2020 high (former resistance is now support). The big test is 1.1660s. 1.1570s is proposed support.
11/2 – The near term picture for EURUSD is a mess but don’t forget that price continues to hold the 200 week average and a well-defined long term horizontal zone. As such, any near term developments would be viewed with increased interest. At this point, that would mean establishing above 1.1700. For now, I see nothing to do.
AUDUSD 4 HOUR
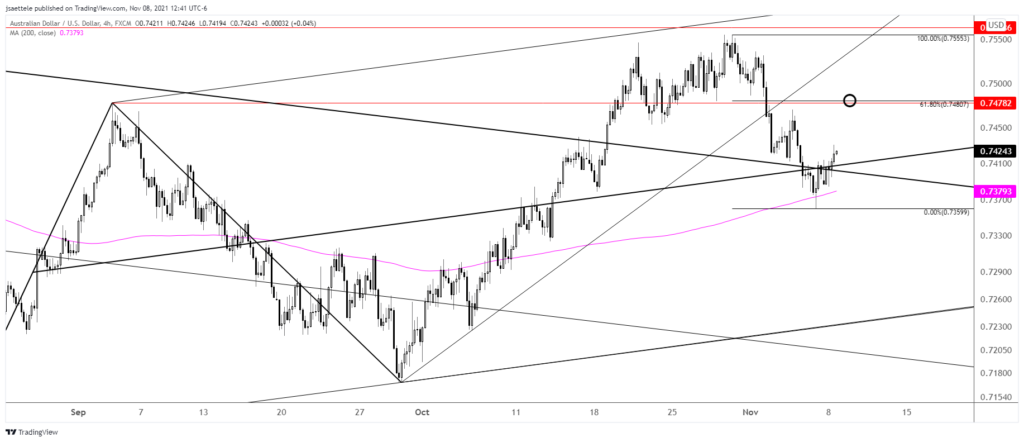
AUDUSD is bouncing following its 5 wave decline from the October high. .7480 remains ideal resistance. This level is defined by the 61.8% retrace and September high. I’m thinking corrective rally into that level before another leg lower that takes price under .7360.
11/4 – The AUDUSD wave count remains the same despite today’s drop. With price testing the well-defined .7385 pivot, I’m thinking rally attempt in order to correct the decline from the late October high. Eventual resistance is .7480.
USDCAD DAILY
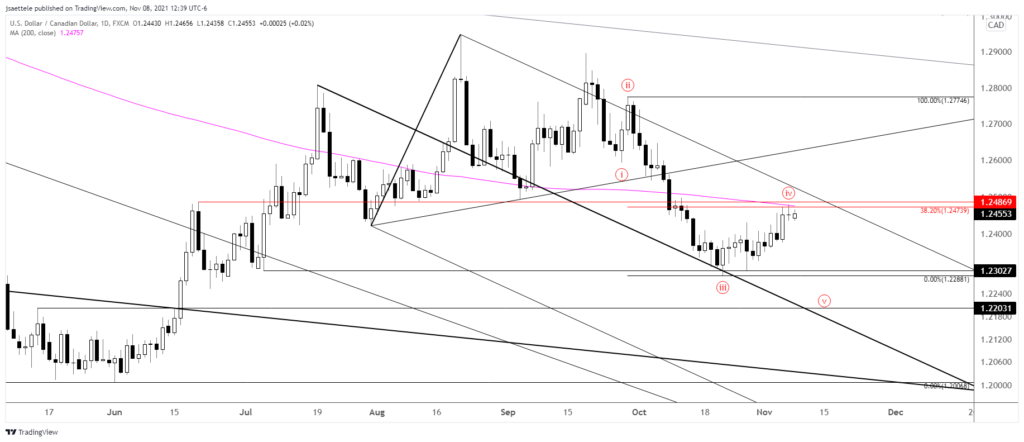
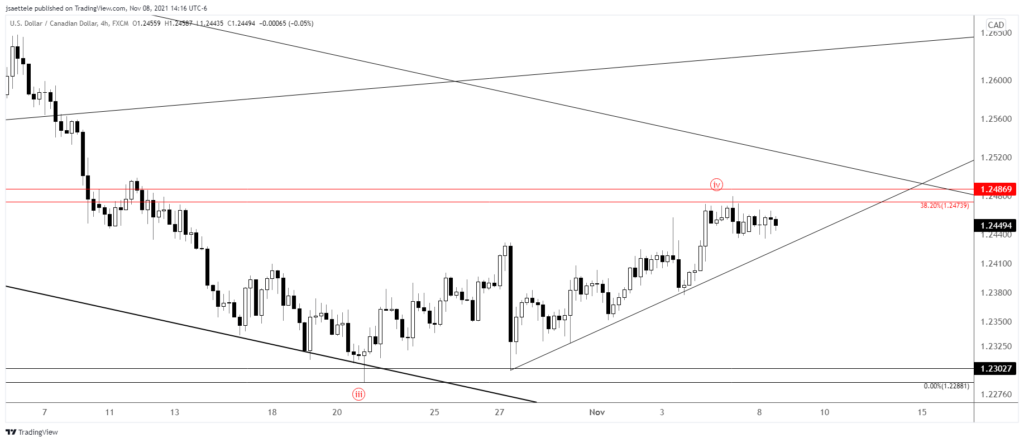
Friday may have been the 4th wave in USDCAD. The high is 1.2480, which is pips above the 38.2% retrace of wave 3 and right on the 200 day average. The September low is just above as well. Weakness below the short term trendline would act as a trigger for the short side (see below).
11/4 – It took a while but USDCAD is into proposed 4th wave resistance. Be on alert for reversal evidence between here and 1.2530. This could occur with a spike on Canadian and U.S. jobs numbers tomorrow.
USDCAD 4 HOUR
AUDJPY 4 HOUR
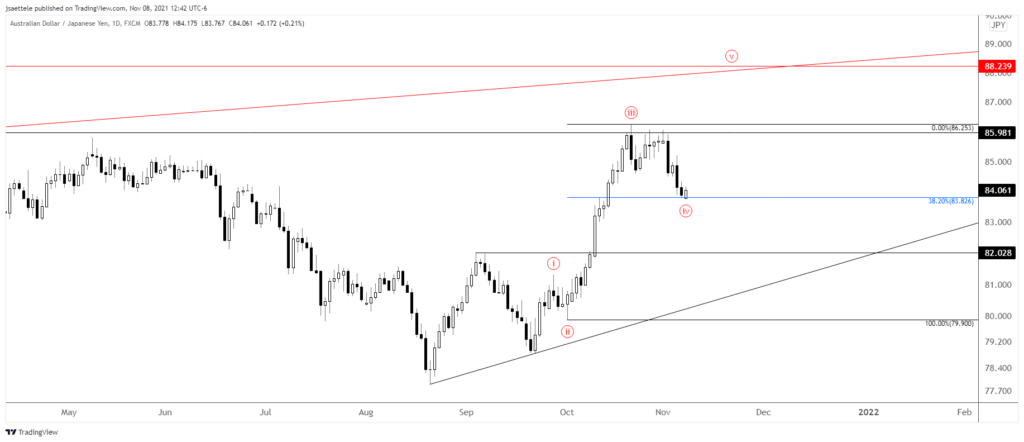
AUDJPY has dropped into proposed 4th wave support at 83.83. Again, this is the 38.2% retrace of wave 3. I ‘like’ this cross higher but don’t have much of a setup or entry. Price continues to chop near the lows which makes stop placement difficult (risk of getting stopped out on a spike lower is higher than normal).
10/21 – Today’s AUDJPY high is probably the end of wave 3 within the 5 wave rally from the 9/22 low. Ideal wave 4 support is the 38.2% retrace of wave 3 at 83.83. This intersects with the top side of former corrective channel resistance. In other words, support is well-defined. Near term proposed resistance is 85.49.
NZDJPY 4 HOUR
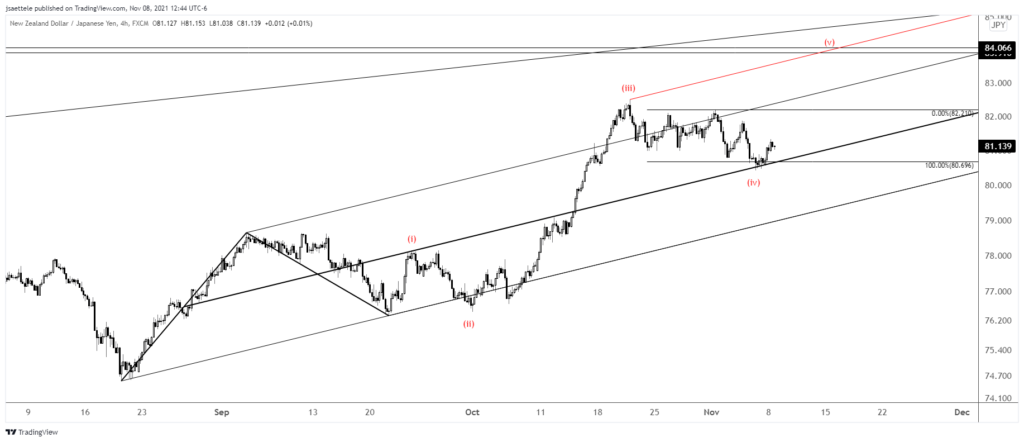
I like this NZDJPY setup better than AUDJPY for entry. The decline from the October high is in 2 equal waves. The center line from the channel that originates at the August low provided support after acting as resistance in September and October. Upside focus is the 2017 high at 83.91. 80.90 should provide support.

