Market Update 11/8 – November is for turkey!
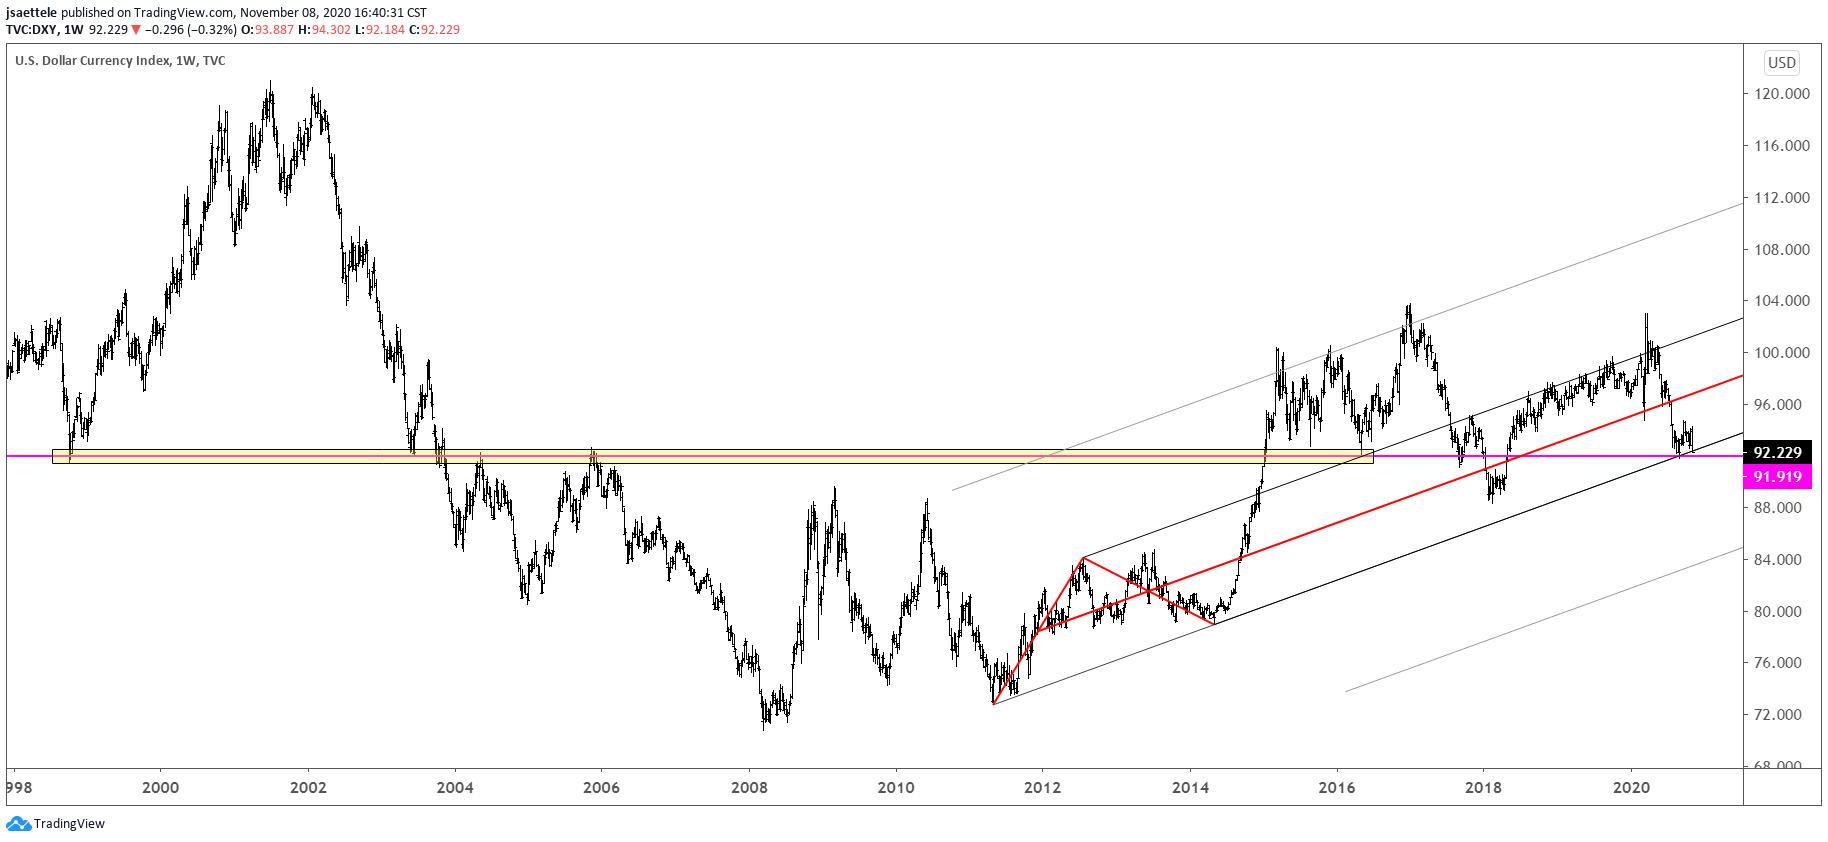
DXY WEEKLY

DXY continues to trade at/just above a major long term level. Nothing has changed. This is support until broken (daily closing basis at least). The UUP (see below) warns that last week’s drop is a trap. The red bars on the UUP chart show when price closed at a 52 week low with volume at least as high as it was last week (1.8 x the 13 week average). Every instance except one (highlighted in yellow) was a capitulation low. Stay tuned.
UUP WEEKLY

USDOLLAR DAILY

Be aware of the median line from the long term bearish for in USDOLLAR, currently near 11870. The line was support in September and could be again. A break below eliminates anything constructive and the prospects of a USD crash would then be very real (median line acceleration). In the event of a break below, the median line becomes resistance and the next (longer term) target wouldn’t be until the 75 line, which is near the 2018 low of 11506.
SPOT GOLD DAILY

Gold broke above the resistance line and that line is now proposed support near 1911. 1990 is a possible reaction level. The objective from the flag that has formed since the August high is 2300.
11/4 – So much for getting clarification on trends following the election, which apparently isn’t over. Price continues to sit just under resistance from a trendline, the 2011 high, and the 50 day average (not shown). A break above would be bullish but resistance is resistance until broken so focus is lower until it’s not…that simple.
USDJPY 4 HOUR

USDJPY has broken below the center line of the channel from the March high. This line was just support on 10/29 and is therefore proposed resistance near 103.70. Downside objective are daily reversal support at 102.35 and the March low at 101.18. Remember, 101.00ish is MASSIVE (see below).
USDJPY WEEKLY

AUDUSD 4 HOUR

My first reaction when viewing AUDUSD price action from the September high is that a flat or triangle is unfolding. I mention this because the drop into the September low is in 3 waves and therefore most likely a B wave. This leaves everything from the September low as a B wave of one larger degree. If this sounds like hocus pocus, then just focus on the levels….7325/45 is proposed resistance.
EURUSD 4 HOUR

EURUSD analysis/thoughts are similar to AUDUSD with respect to the flat/triangle scenario from the September high. Pay attention to 1.1916 and especially 1.2011 for resistance. The latter level is the September high and long term trendline resistance. Proposed support is 1.1750/90.
USDTRY WEEKLY

Based on long term slope analysis (parallels), USDTRY reached resistance last week. I like the short side now…that simple. Also, a bullish volume reversal triggered on a weekly basis for TUR (see below). Previous signals have coincided with USDTRY tops. Also, EidoSearch results are overwhelmingly bullish TRY (results are below).
TUR (MSCI TURKEY ETF) AND USDTRY WEEKLY

USDTRY 3 MONTH LOOKBACK AND 1 MONTH FORWARD EIDOSEARCH

EURTRY 3 MONTH LOOKBACK AND 1 MONTH FORWARD EIDOSEARCH

TRYJPY 3 MONTH LOOKBACK AND 1 MONTH FORWARD EIDOSEARCH


