Market Update – July 29
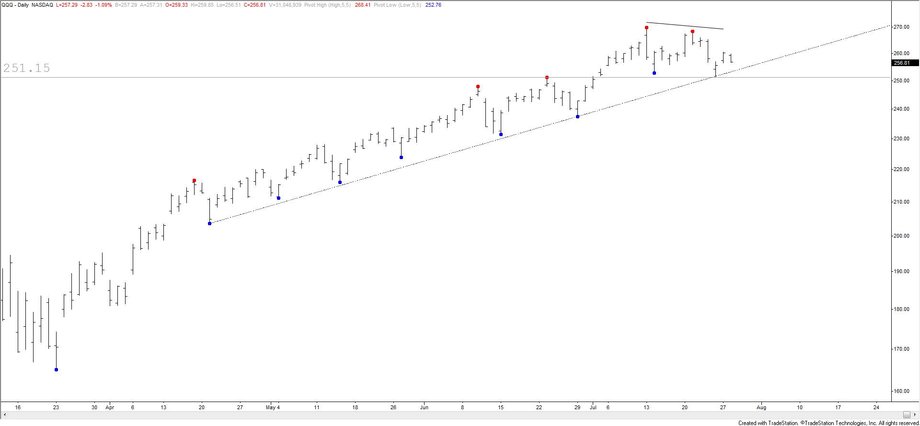
QQQ DAILY
Today was the first day since the rally off of the March low that QQQ made a lower pivot high with 5 day strength. That means that there are 5 days on each side of the high. This is an objective way of saying that price made has made a lower high for the first time since this rally started. A break under 251.15 would warrant a short. I also just saw on Bloomberg that cross asset correlation recently hit a 25 year high. If QQQ breaks, then it would make sense that the USD turns up as well.
SLV WEEKLY

Silver (and some FX majors) hit major VWAP levels today. SLV hit VWAP off of the 2011 high. Spot silver (see below) reached the 38.2% retrace of the decline from 2011 (exactly). Good spot to take a stand.
7/27 – Pay attention to silver at 25.12-26.23. This is the September 2013 high, 2011 and 2012 support, and the 38.2% retrace of the decline from the 2011 high. If this freight train is going to stop for at least a short while, then this would be a good range to provide resistance. Also, daily RSI is above 84! Prior instances are shown with the next 2 charts (note that this is only since the inception of SLV). The only time that a reading this high didn’t mark an important top was in October 2010.
SILVER SPOT DAILY

U.S. DOLLAR INDEX FUTURES DAILY

USD Index futures have reached VWAP from the 2018 low (slipped slightly below actually). I’m especially interested to see where this closes the week and month. The long term VWAP reinforces the long term channel as a level of importance.
7/27 – So much for ‘extreme sentiment’ towards the USD. DXY dropped for a 7th straight day today. Price is now testing the trendline from the 2011 low. The lower parallel from the channel off of the March high is slightly lower…about 93.15 (see below). At this point, I’m not sure where the next level of interest is if DXY fails to hold.
EURO FUTURES DAILY

Euro has reached VWAP from its 2018 high. I was thinking slightly higher (1.1823/52) before taking a stand against EURUSD but if price starts to roll over now then it may not be worth waiting given that the long term VWAP level has already been hit. Nothing to do just yet.
7/27 – EURUSD is fast approaching the top of the channel from the 2008 high. The level is bolstered by the 61.8% retrace of the decline from the 2018 high and highs from September and June 2018 at 1.1823/52. Big level so maybe EURUSD stops going up everyday. Also, daily RSI is above 81. The next 3 charts show previous instances of daily RSI above 81. Most of these extreme RSI readings led to either sideways trading or formation of a top.
AUSTRALIAN DOLLAR FUTURES DAILY

VWAP from the 2018 high in AUD futures have also been hit! The long term channel resistance is slightly higher…about .7215 (see below). Either way, we’re in the zone to consider going the other way. Weakness below .7065 (June high and Friday’s low) would be a decent sign that some sort of a ‘tradable’ high is in place. Until then, don’t forget about the channel line near .7215.
AUDUSD DAILY

NEW ZEALAND DOLLAR FUTURES DAILY

Guess what? Kiwi futures have also reached VWAP from the 2018 high. Same story here…I’m interested in going the other way. The lower channel line from the channel off of the March low is about .6550 (see below). If that breaks, then shorts are in order. Until then, be aware of the year open at .6724.
NZDUSD DAILY


