Market Update 7/27 – European FX Levels Pre-FOMC
EURUSD 4 HOUR
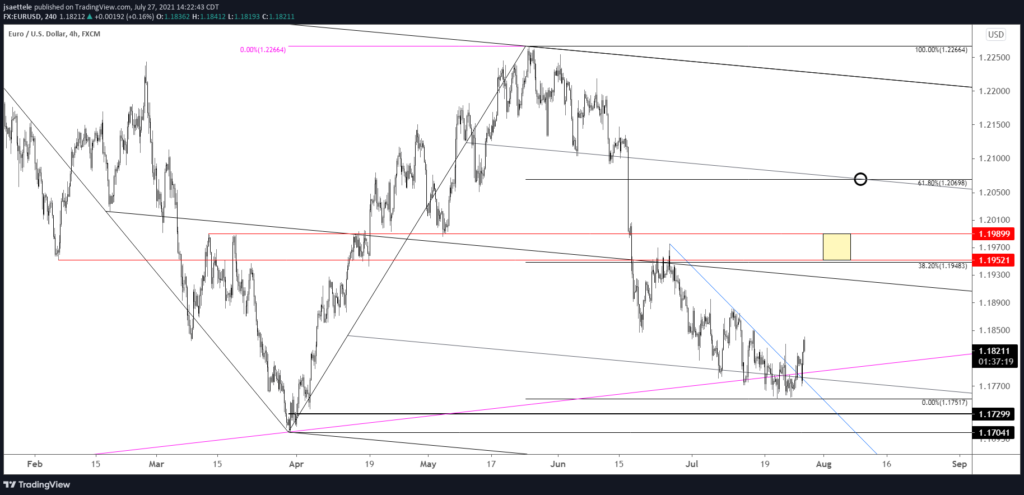
Focus remains higher for EURUSD following today’s hold. In fact, price pulled back to noted support and immediately turned higher. FOMC is tomorrow. The only reason I mention that is because of the potential for increased volatility. Even if you told me what Powell would say tomorrow, it wouldn’t matter. Only the reaction matters! Bottom line, price has held support (for now at least) so I’m looking higher towards the well-defined 1.1950/90 zone.
7/26 – EURUSD has been churning near lows for weeks, putting in divergence with RSI on both the daily and 4 hour time frames. The break above the line from the 6/25 high warrants a long position. Watch for 1.1780 support. General focus is the center line and 25 line within the channel from the February high near 1.1930 and 1.2070 (also the 61.8% retrace).
USDCHF 4 HOUR
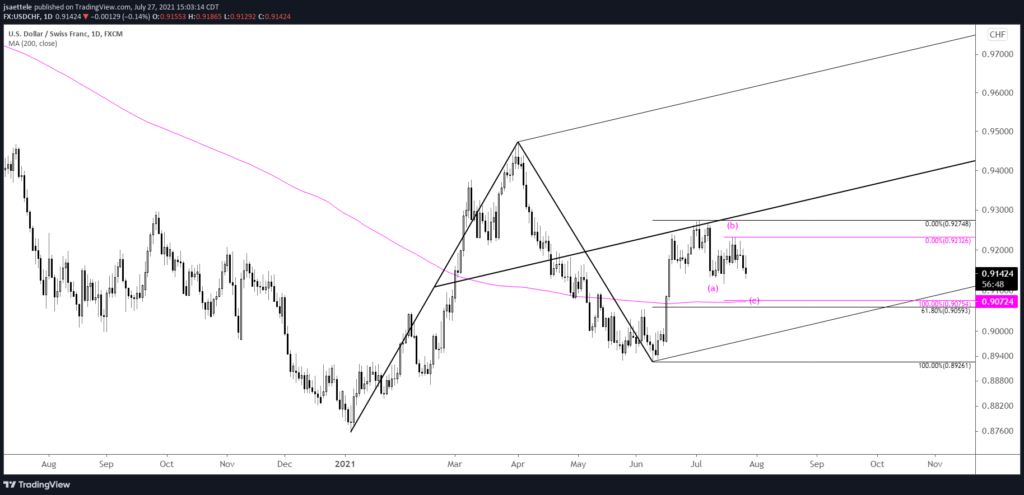
USDCHF could help time the next USD low. To recap, price rallied in 5 waves from the January low the experienced a deep pullback. The rally from June appears impulsive and weakness from the July high is unfolding in 3 waves. Ideal support is .9059/75, which includes the 61.8% retrace of the rally from January, 2 equal legs down from the July high, and the 200 day average.
USDSEK 4 HOUR
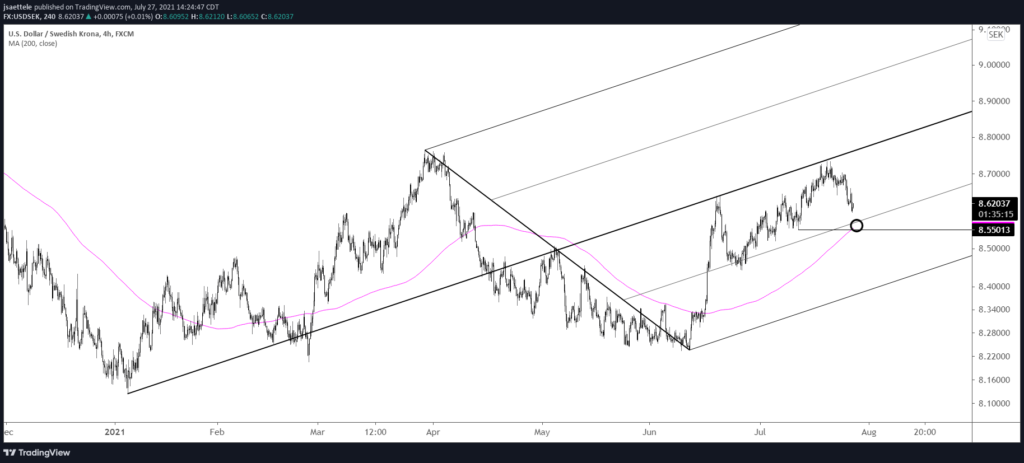
USDSEK is often helpful insofar as identifying near term pivots in European FX (notably EURUSD). This chart is a perfect example. Highs registered at the median line twice in the last 2 months. The 25 line held as support in late June. Watch that line again along with the 200 period average on the 4 hour chart near 8.55.
GBPUSD DAILY
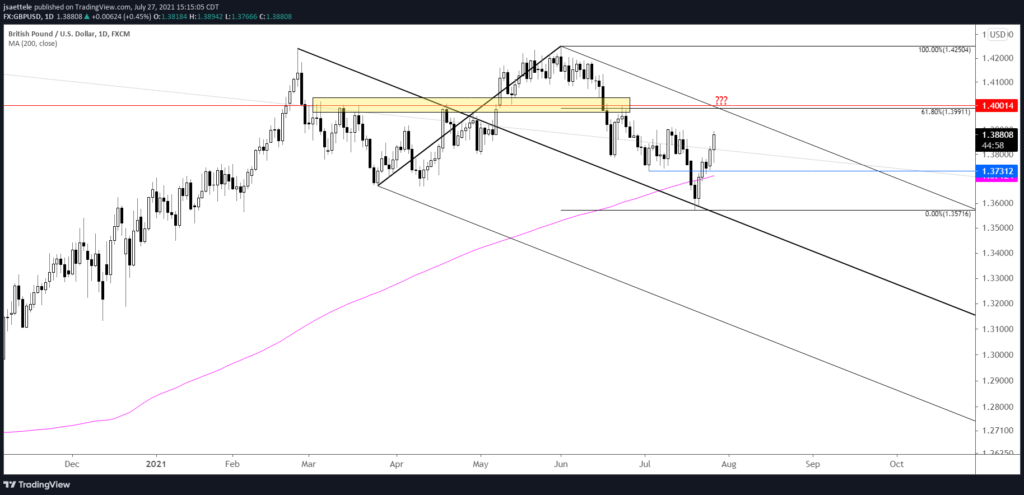
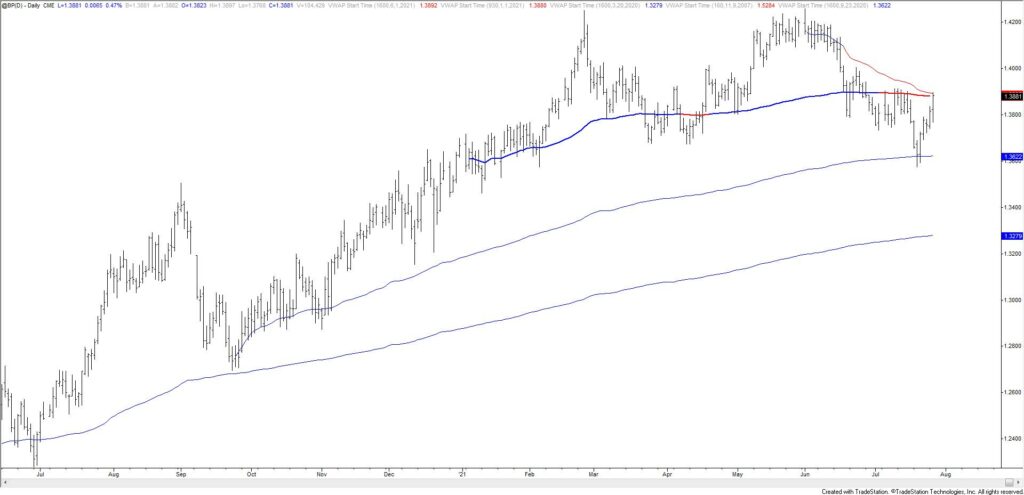
GBPUSD has traded into the VWAP levels noted yesterday (see futures chart below for those VWAP lines). However, there is no indication of resistance (hourly or 4 hour reversal candles for example). As such, I’m wondering if 1.4000 needs to be tested before this takes a breather. The 61.8% retrace is 1.3991 and 1.4000 has been critical since March. Continue to watch for 1.3730 support.
7/26 – Cable has rallied as suggested and is nearing proposed resistance from 2021 VWAP and VWAP from the June high at 1.3900 (see futures chart with VWAP levels below). Ultimately, the rally appears impulsive so I am ‘thinking’ that weakness proves corrective. 1.3730 is the initial level to watch for support.
BRITISH POUND FUTURES 4 HOUR
NZDJPY 4 HOUR
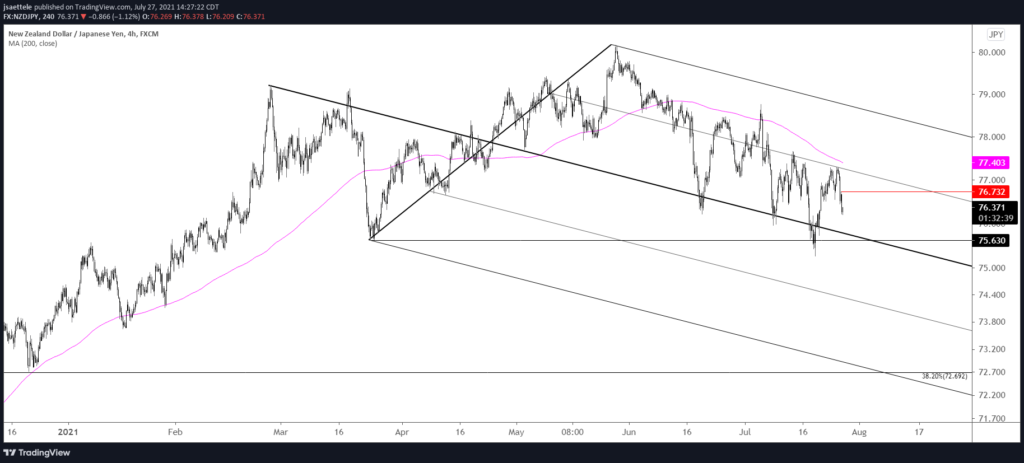
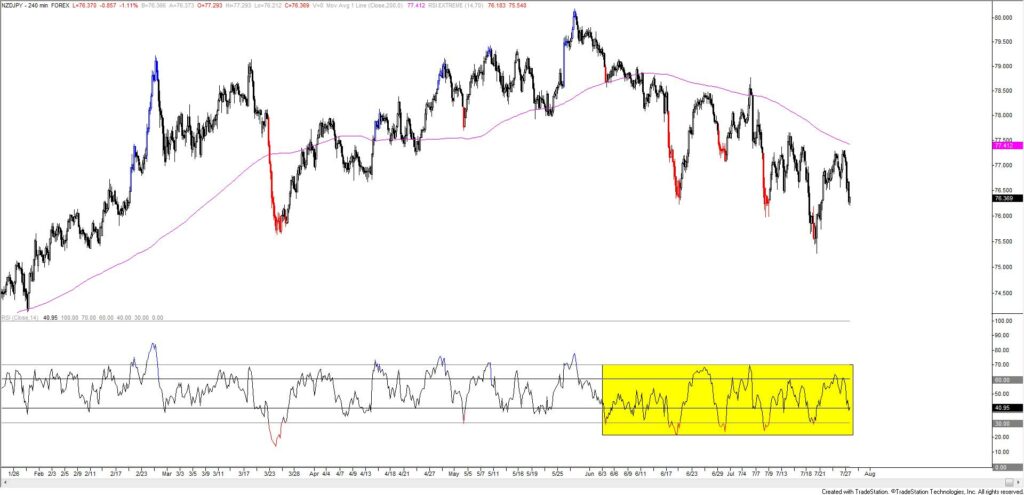
NZDJPY traded up to 77.30 before rolling over today. Price rolled over just prior to reaching the 200 period average on the 4 hour chart. This average has been a decent trend filter. Also, the chart below shows 4 hour RSI. The RSI profile is currently bearish. This occurs when RSI is below 30 at price lows AND below 70 (often near 60) at price highs. 76.70/90 is proposed resistance.
7/20 – NZDJPY also took the 3/24 low before reversing. I like NZDJPY better than GBPJPY though due to the 200 day average hold. Price also held a short term channel. I’m willing to play a bounce towards 76.60s initially and then reassess.
NZDJPY 4 HOUR
