Market Update 2/22 – USDRUB Reverses…Time for a Risk Squeeze?
DJIA DAILY
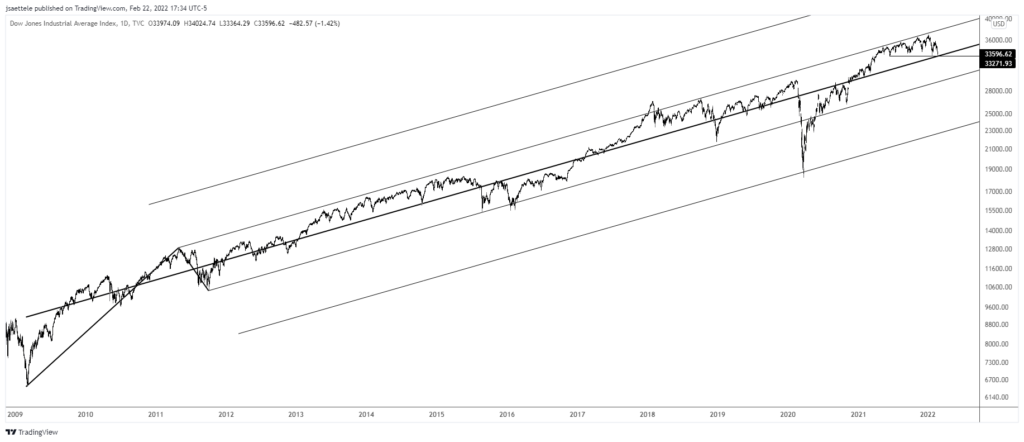
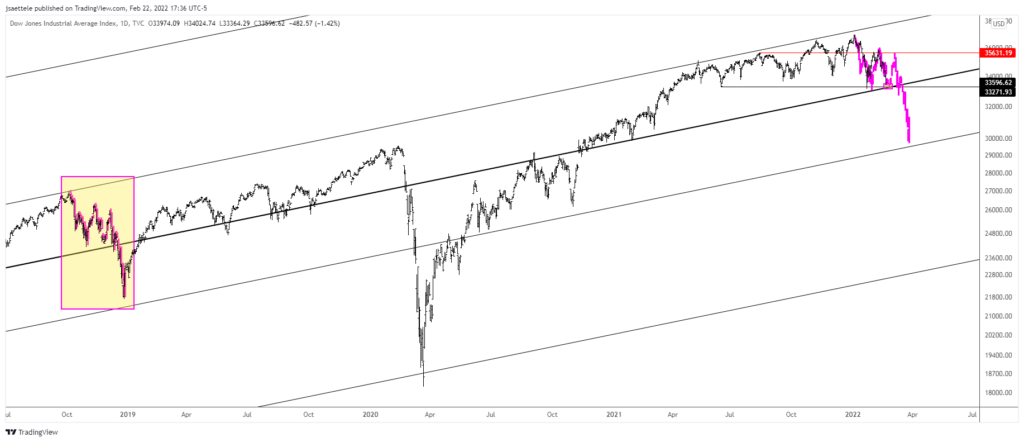
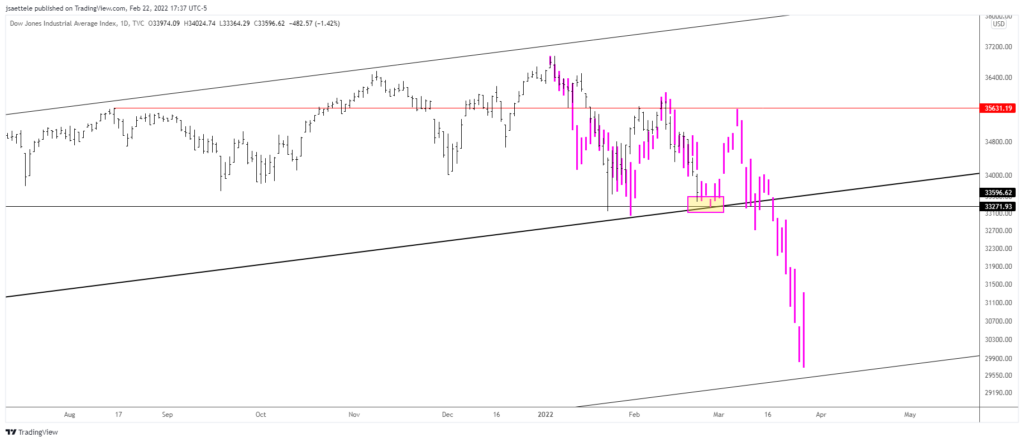
The ‘Dow’ has come into the median line of the Schiff fork that originates at the 2009 low. This line has produced a lot of pivots. Interestingly, price action is similar to 2018 (see next 2 charts). If the comparison holds, then we’re due for a squeeze…maybe back to 35630 or so.
DJIA DAILY
DJIA DAILY
SPOT GOLD DAILY
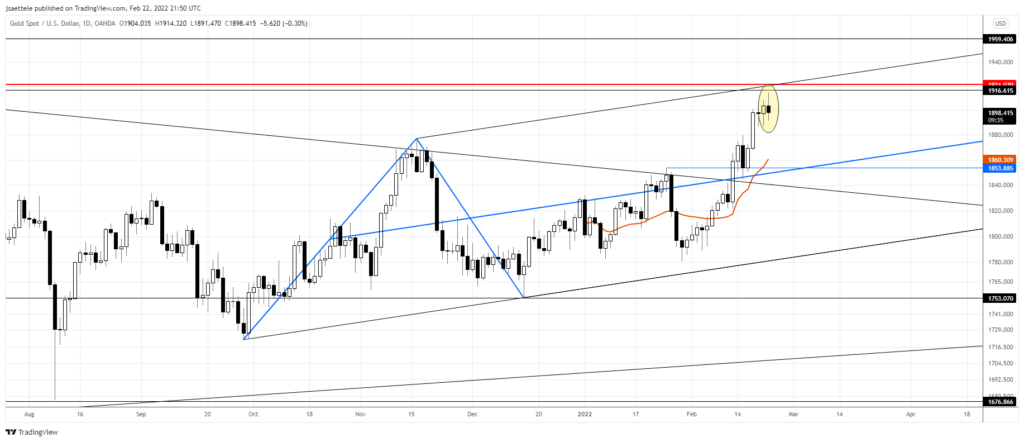
Spot gold printed 1914 today (futures 1918) and price put in a daily reversal. I’m thinking that there is risk of a pullback into 1854 or so…then reassess.
2/17 – If the gold breakout is going to face problems then it probably happens near 1920. This is just above the June high, short term channel resistance, and the 61.8% retrace of the decline from the 2020 high. It’s also the 2011 high (see below). In the meantime, 1877 and 1854 are proposed supports.
SPOT SILVER DAILY
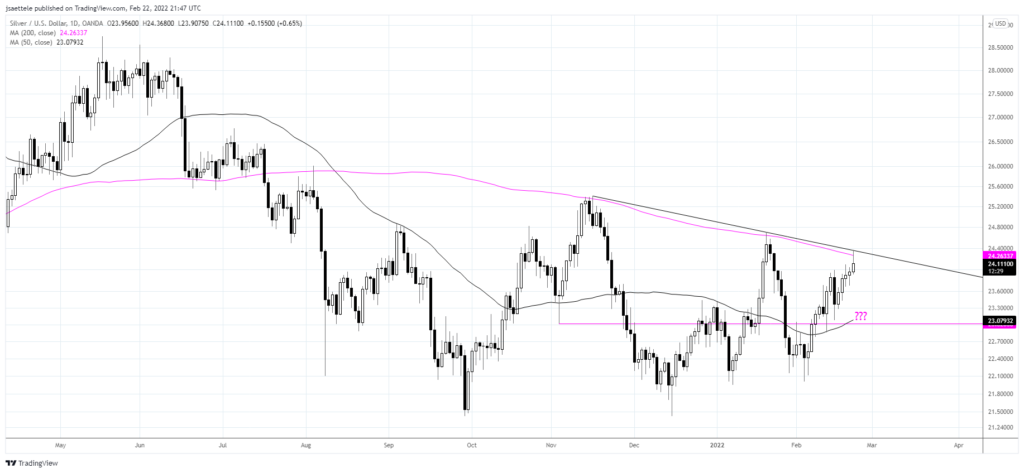
Silver tagged the 200 day average and line that extends off of the November and January highs. The level is extremely well-defined so I’m thinking lower as long as this level holds. Remember, resistance is resistance until broken! 23.10 (give or take) is proposed support.
2/17 – Keep in mind that silver is still nowhere near breaking out. This should be concerning for precious metal bulls in general because the silver/gold ratio tends to rally during ‘real’ metal bull markets. The breakout test isn’t until about 25. 23.10/20 is proposed support.
USDOLLAR DAILY
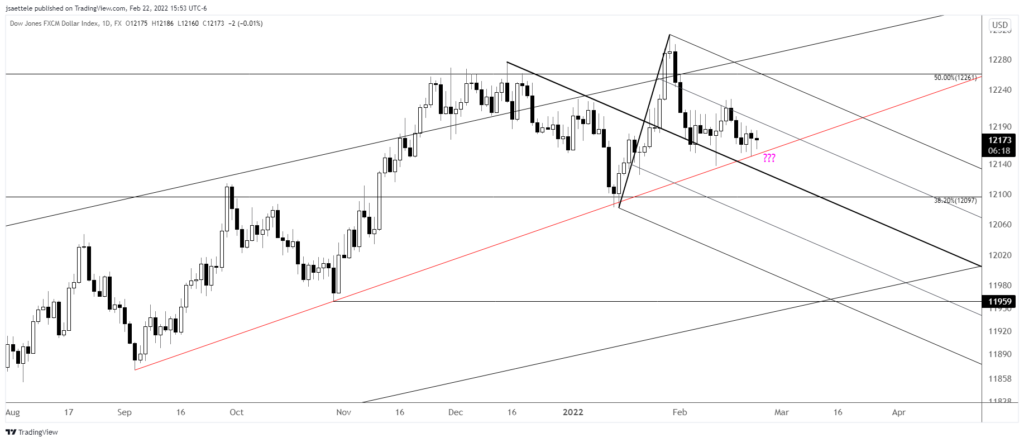
USDOLLAR has done absolutely nothing the last 4 days. However, keep this chart front and center because a break below the trendline from September would strongly suggest that the USD trend is lower. Until then…’hurry up and wait’.
2/16 – The USDOLLAR bounce appears over as price rolled over near the 25 line (half way between median line and upper parallel) of the bearish fork that originates at the December high. The trendline from the September low remains the key technical pivot near 12145. Weakness below there should lead to acceleration of USD weakness. Levels of interest at that point would be 12070s and eventually 11959.
USDRUB DAILY
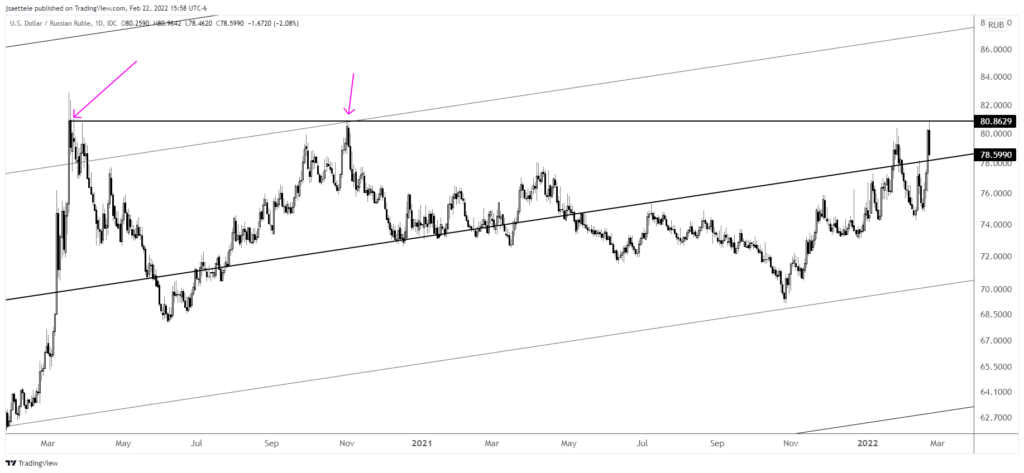
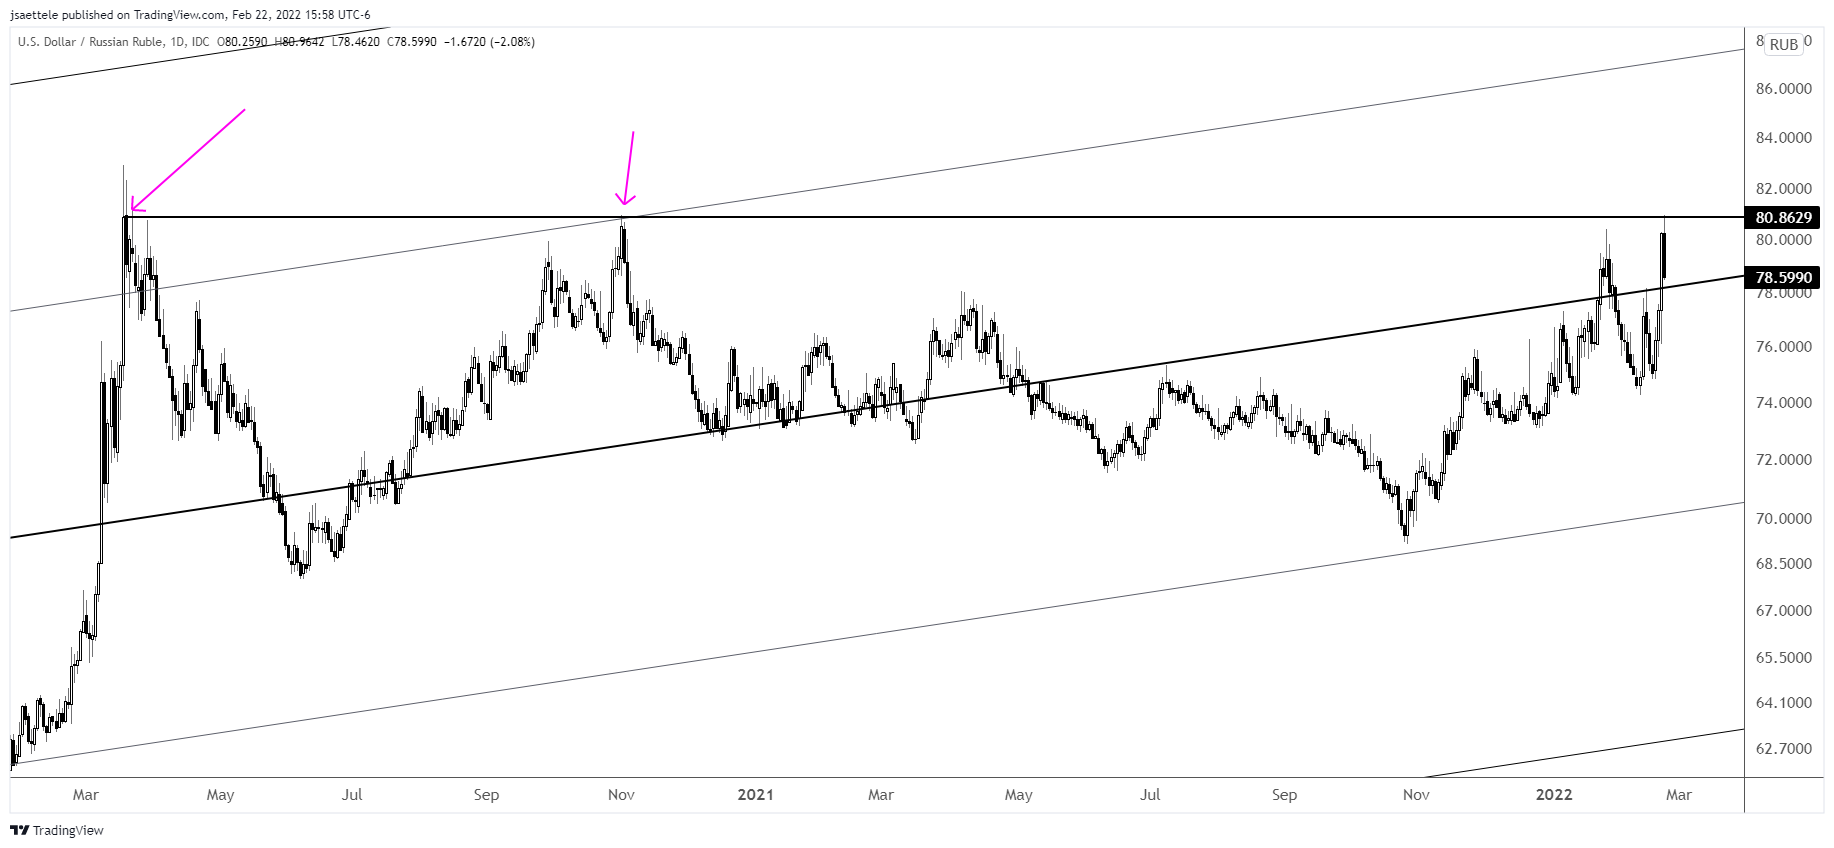
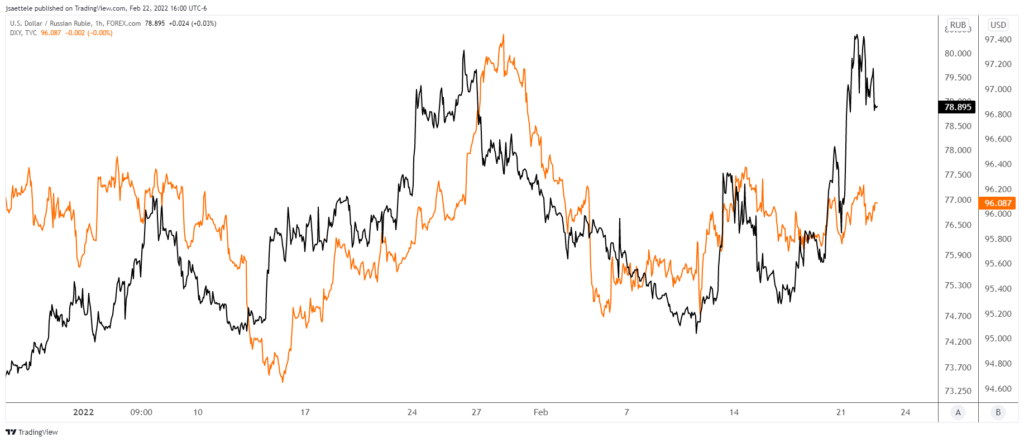
You may have heard that Russia is in the news. USDRUB reversed sharply lower today after tagging daily reversal resistance (daily high close from March 2020). This level was also resistance in November 2020 (U.S. election). The reversal lower today ‘fits’ with a coming squeeze in equities and a pullback in gold. I’m wondering if the USD also breaks down. The chart below shows USDRUB and DXY since the beginning of the year. Let’s see…
USDRUB AND DXY HOURLY
NZDUSD DAILY
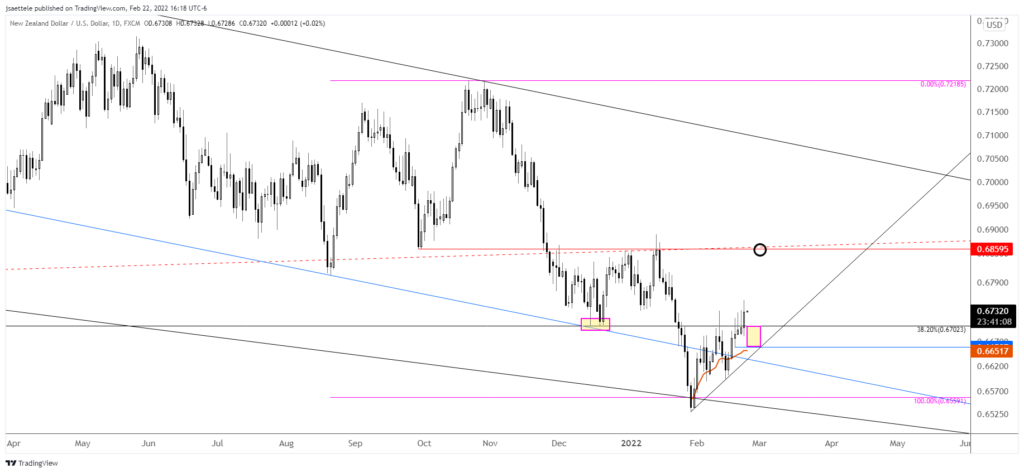
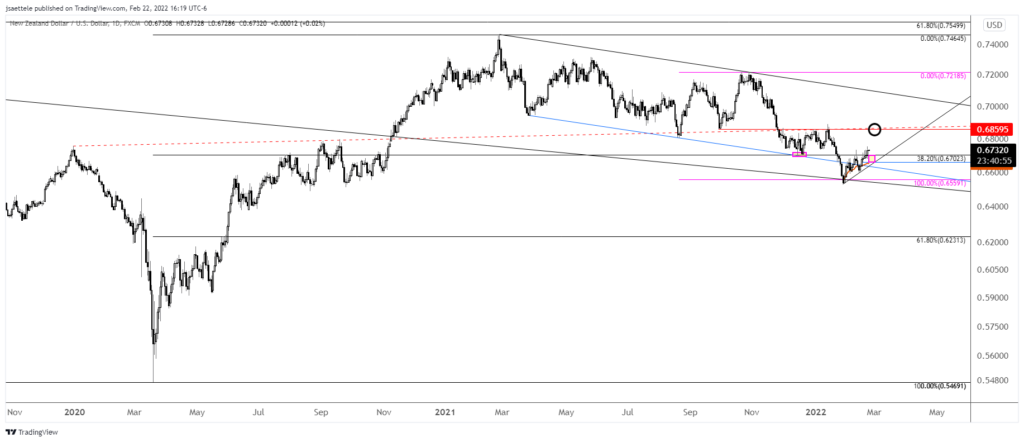
I remain constructive Kiwi…proposed support is .6650-.6700. This is a wide range but RBNZ is today so be prepared for a spike. A spike into this zone would present an opportunity to align with the long side and target .6860 initially. A zoomed out version is below.
2/17 – NZDUSD is testing former support at .6700. A break above opens up the next important level near .6860. Proposed support is .6640/50. If price breaks above the median line before pulling back to this level then watch the top side of the median line for support.
NZDUSD DAILY
