Market Update – August 4
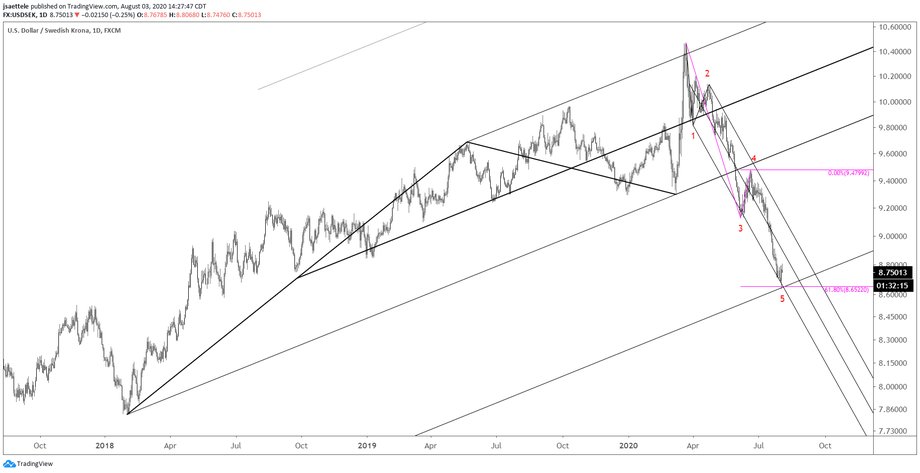
USDSEK DAILY
USDSEK nailed support and reversed higher on Friday from the noted channel extension and Fibonacci relationship. I’m looking for a sizable rebound in the coming weeks and maybe longer. Near term levels to pay attention to are the center line of the channel from the March high near 8.89 and the upper parallel, which is currently about 9.10.
7/30 – USDSEK is nearing the full extension of the channel from the 2018 low. Within the decline from the March high, wave 5 equals 61.8% of waves 1 through 3 at 8.6522. Price is also at the lower parallel of the channel from the March high. I sound like a broken record but this is a logical spot for a reversal attempt.
AUDUSD 4 HOUR

No change to Aussie but I wanted to reproduce this chart because RBA is today. The high volume level at .7173 is now reinforced by the 61.8% retrace of the decline from Friday’s high at .7170. .6990-.7025 remains the initial downside level to pay attention to.
8/2 – AUDUSD reversed on Friday from long term channel resistance. Near term levels to pay attention to are .7173 for resistance (Friday’s high volume level) and .7120 and .6985-7020 for supports. A daily volume reversal also triggered on Friday (see 2 charts down). I’m bearish here.
NZDUSD 4 HOUR

NZDUSD held channel support from the March low today but note that Friday’s reversal occurred from the line off of the July 2019 and December highs. The high volume level from Friday is .6660 and 61.8% of the decline from Friday’s high is .6662…that is now proposed resistance (see hourly chart below). The daily chart below highlights what I call an ‘angle of influence’. Parallels from the line off of the 2017 and 2018 highs cross a number of major pivots, including Friday’s high. The chart of daily futures (also below) shows VWAPs that could eventually provide important support. VWAP from the March low and 2020 VWAP currently cluster near .6300.
7/28 – Guess what? Kiwi futures have also reached VWAP from the 2018 high. Same story here…I’m interested in going the other way. The lower channel line from the channel off of the March low is about .6550 (see below). If that breaks, then shorts are in order. Until then, be aware of the year open at .6724.
NZDUSD HOURLY

NZDUSD DAILY

NEW ZEALAND DOLLAR FUTURES DAILY

GBPJPY DAILY

I still like GBPJPY upside. Ideal support is the lower blue parallel that crosses pivots since May and was recently resistance (hourly chart below shows more detail). This line is in line with the 200 day average at 137.50. Upside focus is 145.00ish, which is channel resistance from February 2018, the upper parallel from the bullish fork, and the February high.
GBPJPY HOURLY


