Market Update 3/14 – NZDUSD into Support Zone
CRUDE OIL 4 HOUR
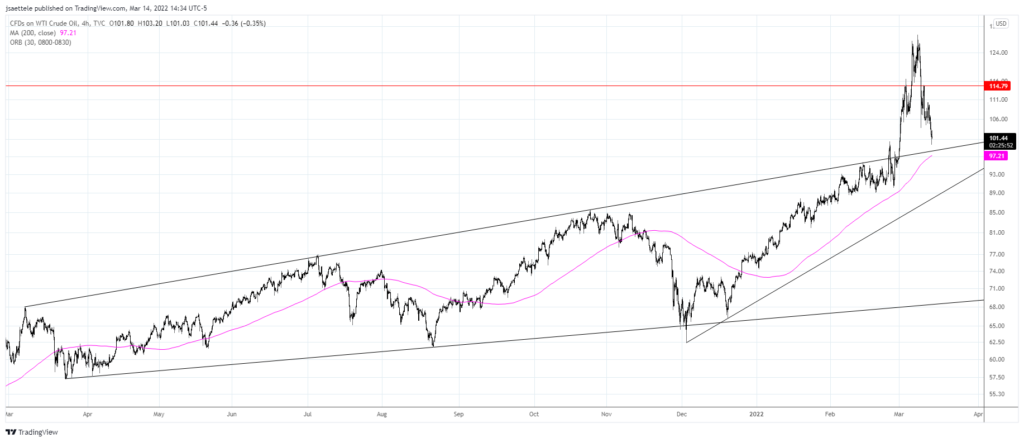
Crude has dumped about $30 from the high…which was made 4 days ago! How about for that a blowoff top?! Price is nearing possible support from the top side of the line that crosses highs since March 2021. That line is about 98.20.
3/9 – That was a blowoff top in crude oil. Interestingly, resistance came in at the same parallel that nailed the Gulf War high in 1990. I’m not going to get into detail on the near term charts just yet other than noting 97.60s for support and 115.50 for resistance. Also, USO completed a high volume 2 day reversal. This last happened in September 2019 (see below).
SPOT GOLD DAILY
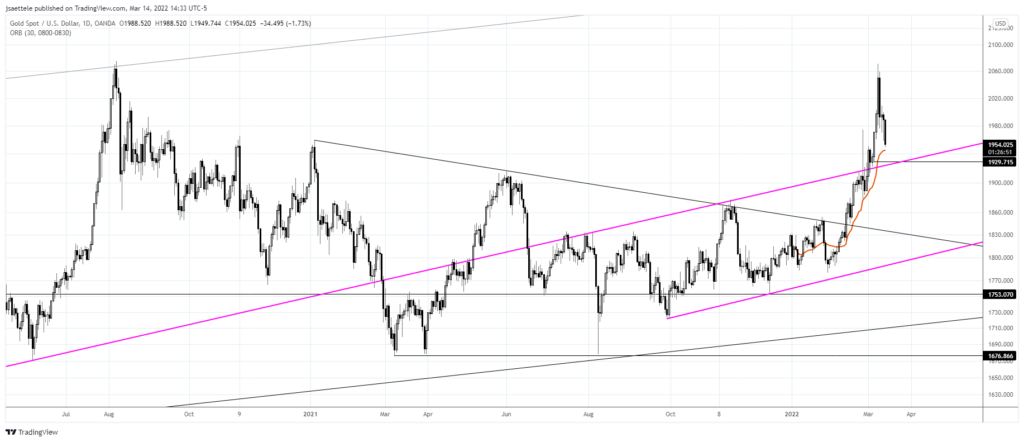
Gold is closing in on 2022 VWAP at 1944. This level, along with the top side of the magenta parallel described last week near 1925, is proposed support. That lower level needs to hold otherwise price risks collapsing back towards the top side of the former resistance line in the 1830s.
3/9 – Gold is pulling back following a breakout…so watch for support! There are several levels to know for support; the January high at 1959, the short term trendine near 1940 (2022 VWAP is 1938) and the magenta parallel near 1922.
Trade on mobile with cTrader
cTrader is one of the world’s leading trading platforms, with versions available in web, desktop, iOS, and android.
Learn more
TLT WEEKLY
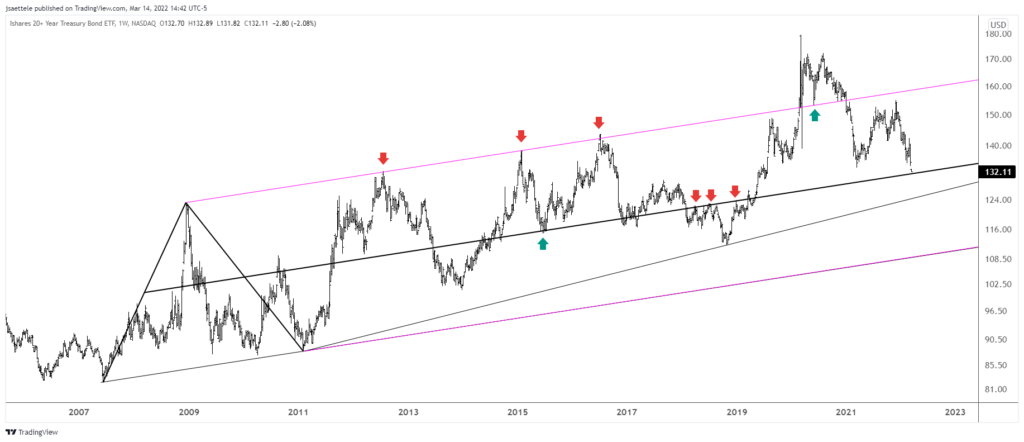
TLT has collapsed but pay attention to the current level, which is defined by the center line of the channel from the 2007 low. This line was precise support in 2015 and resistance throughout 2018…prior to the breakout and COVID blowout into March 2020 highs.
USDSEK DAILY
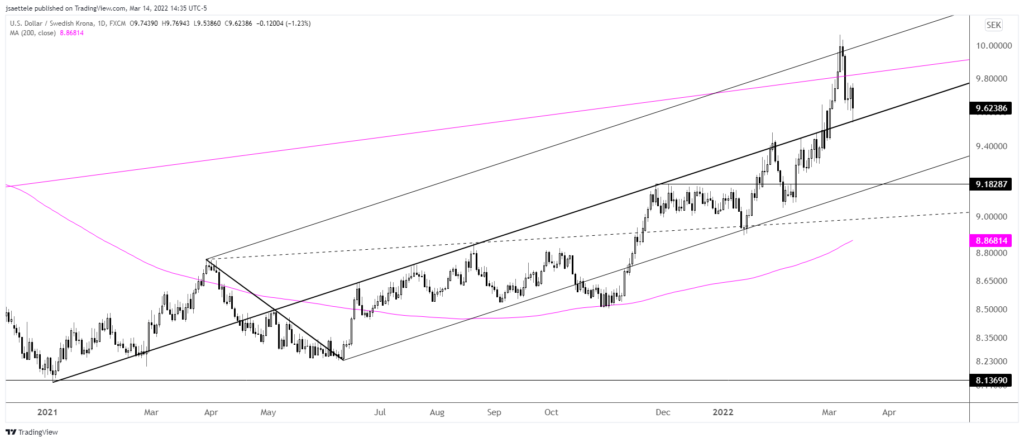
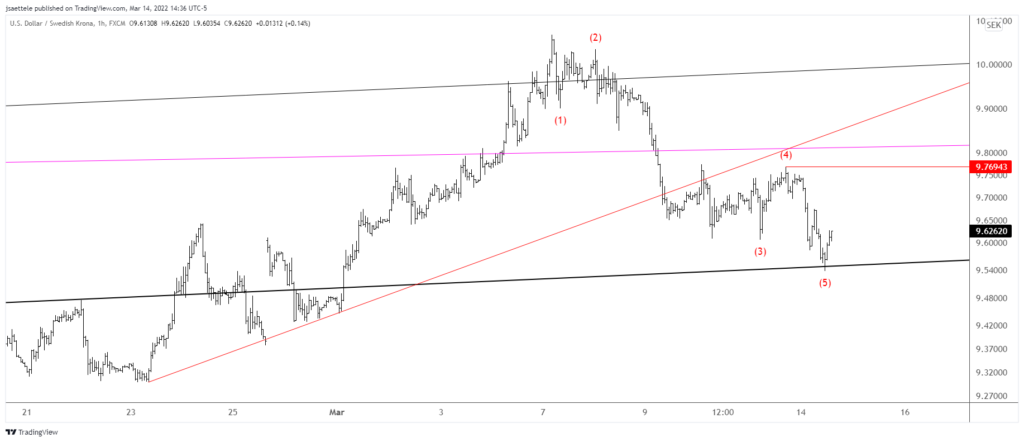
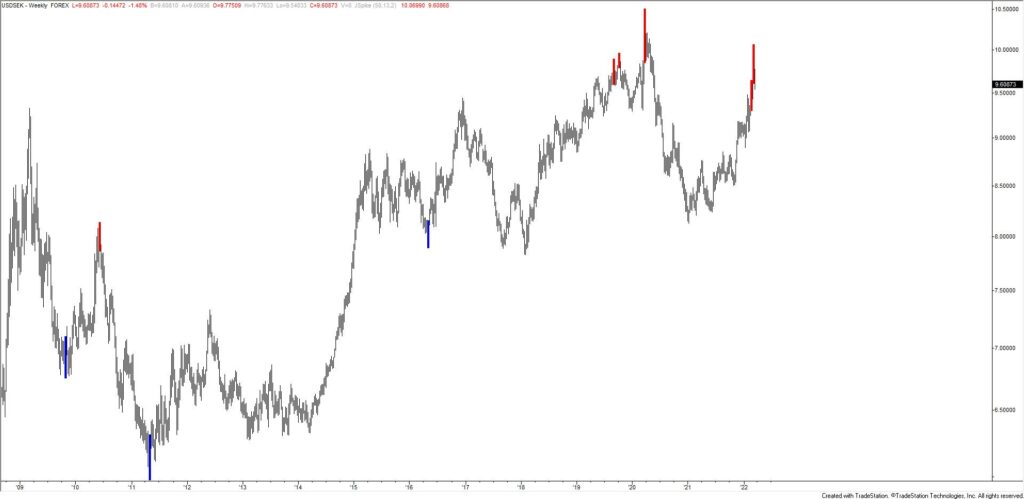
The median line noted last week was reached today in USDSEK. This is possible support for a corrective bounce with initial resistance at 9.77 (see hourly chart below). If price does break down now, then the underside of the median line becomes ideal resistance. Under ‘normal’ correlations, I’d think that EURUSD remains weak given that USDSEK is at support. However, current conditions are anything but ‘normal’ so I’ll refrain from assumptions. Bigger picture, USDSEK did complete the weekly reversal signal explained last week (see 2 charts down).
3/9 – Aside from the late October/early November action outside of the pitchfork from the 2021 low, USDSEK has traded within this structure perfectly. Watch the median line for a bounce near 9.5380. If price drops below the median line, then the underside of the median line becomes resistance. There is also resistance from a parallel on a VERY long term basis (see below). Finally, the same reversal signal that flashed in EURUSD is going to flash this week in USDSEK (again…assuming we close below where we opened the week…see 2 charts down).
USDSEK HOURLY
USDSEK DAILY
AUDUSD DAILY
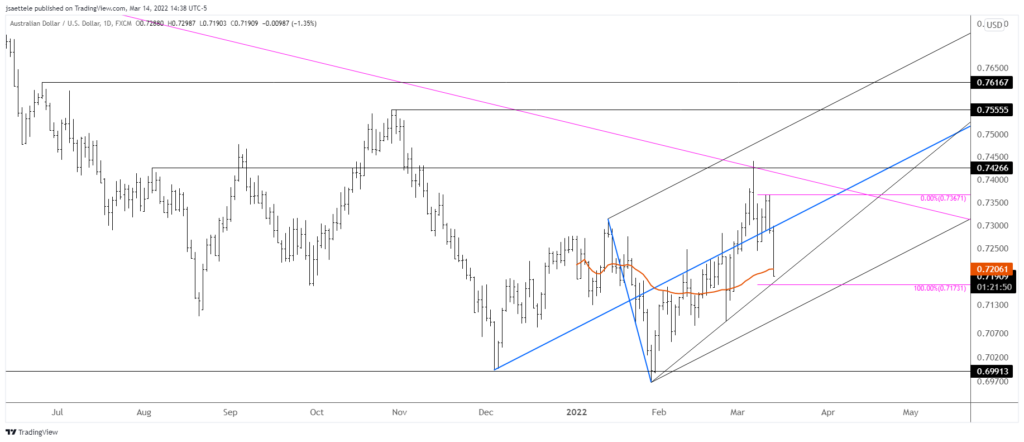
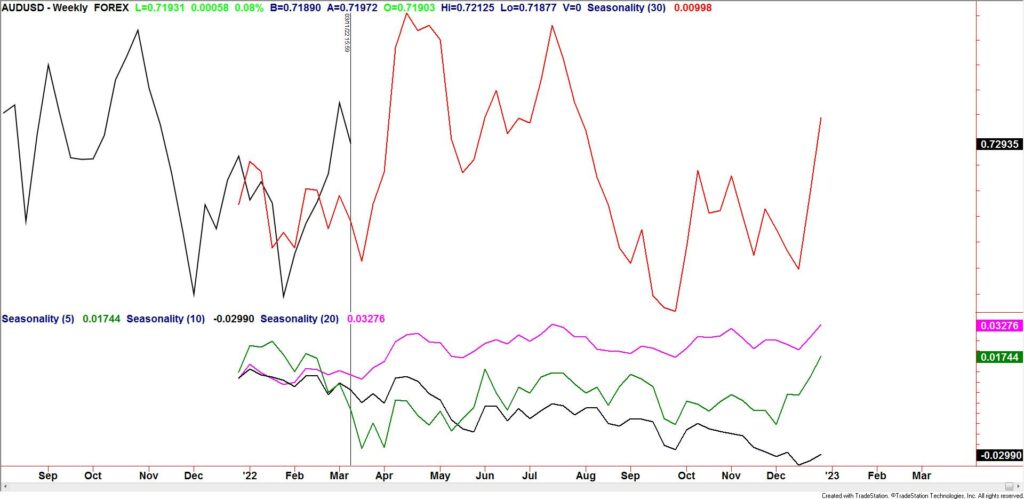
AUDUSD was slammed today as China fell apart. There are 2 levels to be aware of for support, .7173 and roughly .7100. The first level is where the decline would consist of 2 equal legs. The lower level is the lower parallel from the fork that originates at the December low. The long side sets up well from a seasonal perspective as tendencies turn up after this week (see below).
3/8 – AUDUSD followed through on Monday’s reversal but price is fast approaching the well-defined .7220s. There isn’t much change to yesterday’s comments other than noting that .7350 is now proposed resistance.
AUDUSD WEEKLY SEASONALITY
NZDUSD DAILY
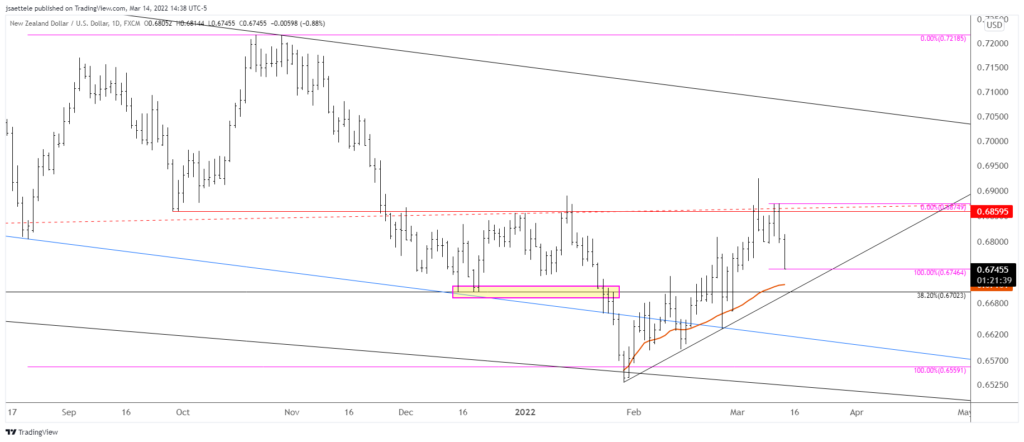
NZDUSD levels are actually better defined than AUDUSD in my opinion for support. Price has already reached 2 equal legs down at .6746 and the well-defined .6700 is just below. This is defended by the trendline from the lows and 2022 VWAP at .6719. Bottom line, .6700/50 is a big zone and well-defined for support. I’m looking for Kiwi to turn up and begin another leg higher within the bull cycle from the January low.
3/8 – .6850 held as resistance in NZDUSD. This level remains resistance. I favor selling into that level and targeting trendline support near .6700. In the interim, price could bounce near .6770.


