Market Update 3/10 – Yen Crosses about to Break Out?
EURUSD HOURLY
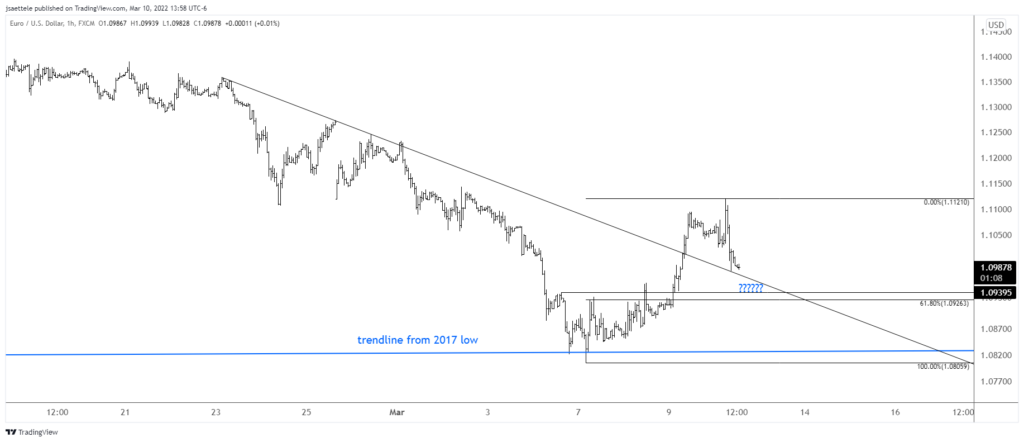
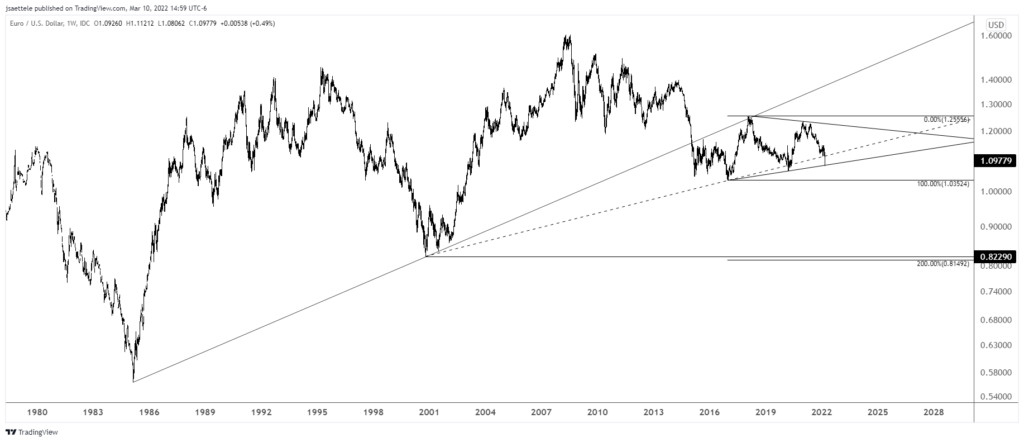
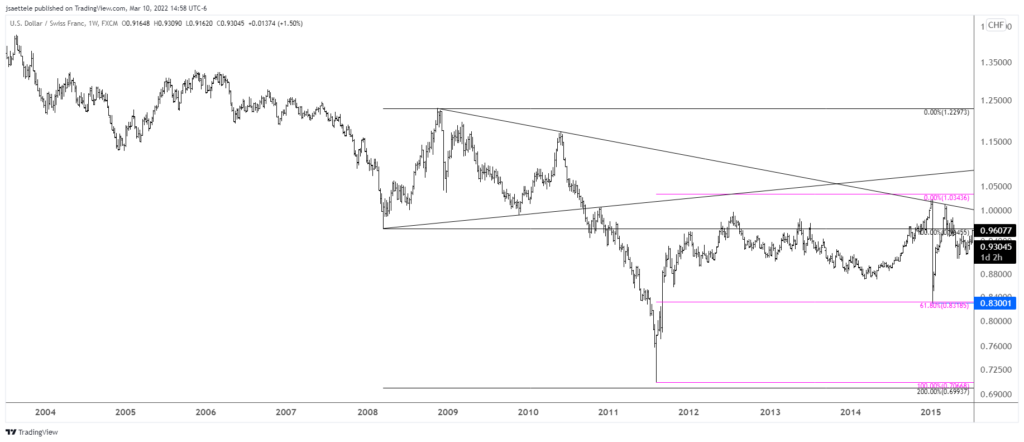
EURUSD nailed the noted levels, spiking into 1.1120 on ECB and trading at 1.0980 as I type. I’m ‘thinking’ that EURUSD finds a higher low between here and 1.0926/40. Of course, if this week’s low doesn’t hold then a full on crash from a 5 year triangle is possible (see long term chart below). In fact, the 3 legged triangle reminds me of the USDCHF pattern from 2008-2010 (see 2 charts down). Keep an open mind.
3/9 – EURUSD has broken above the short term upper parallel (shown on this chart in blue). The top side of that line is now support. The line is 1.0980-1.1000 throughout Thursday. Former lows at 1.1120 and 1.1230 are possible resistance levels. The latter level is reinforced by 2022 VWAP. I’m of the mind that a major low is in place for EURUSD. Remember the trendline posted earlier this week? The chart below shows this line along with proprietary reversal signals. A signal will register this week, assuming we hold up of course.
EURUSD WEEKLY
USDCHF WEEKLY (2008-2010 TRIANGLE)
AUDJPY WEEKLY
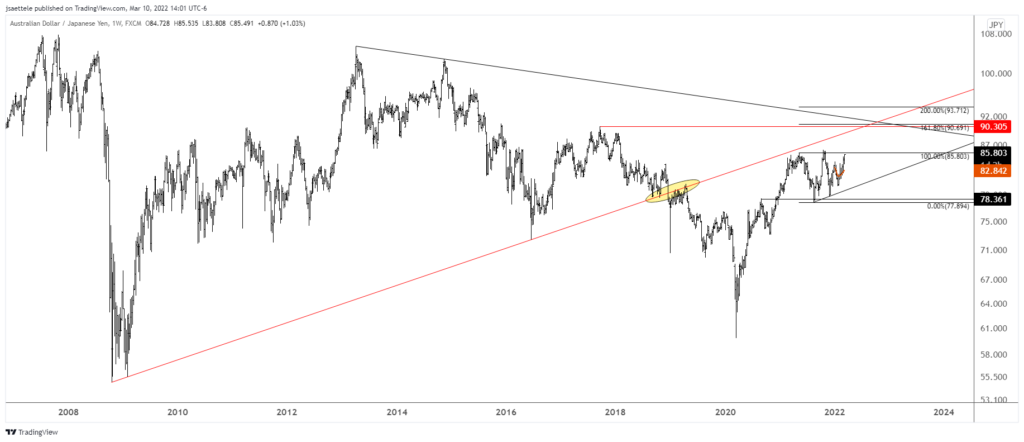
AUDJPY action since last May is an ascending triangle. The pattern portends a bullish outcome. What’s more, the cross is historically a decent barometer of risk appetite. Well, equities have been slammed for months yet AUDJPY is pressing the highs. This alone is reason to suspect an imminent breakout. A breakout occurs above 86 and would target the September 2017 high at 90.30 initially.
Trade on mobile with cTrader
cTrader is one of the world’s leading trading platforms, with versions available in web, desktop, iOS, and android.
Learn more
CADJPY DAILY
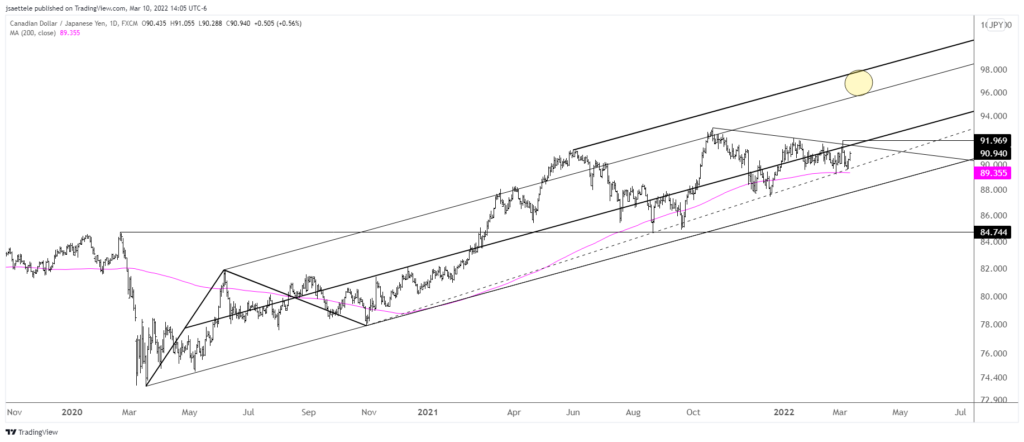
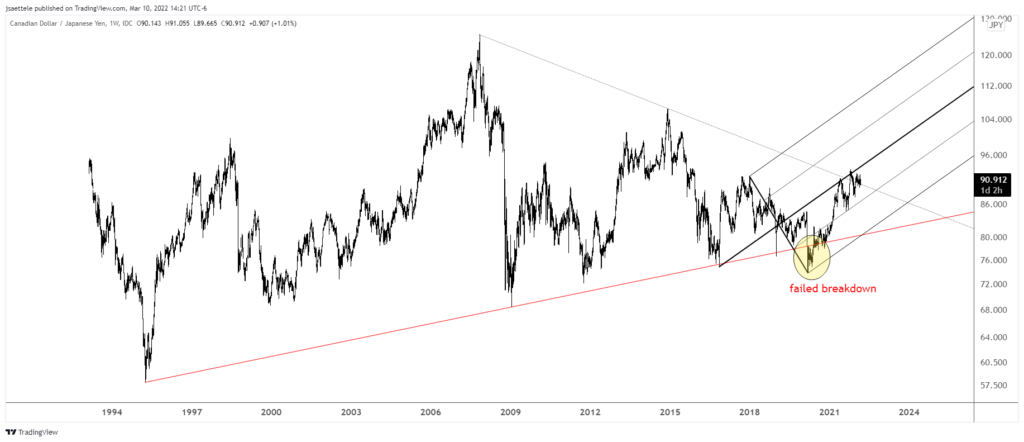
One week ago I posited that a crude reversal would occur along with CADJPY weakness. Crude reversed but CADJPY continues to hold support. As such, entertain longs above 92 and target parallels near 96 and 98. On a long term basis, it’s possible that a massive breakout is about to commence (see below). Keep an open mind (that’s the theme of this post)!
3/3 – IF crude is turning lower THEN short CADJPY could be huge. The weekly chart below highlights the trendline from 2007 (drawn off of closes). Also, the October 2021 high is right at the 61.8% retrace of the decline from 2014 and price channels beautifully from the 2020 low. It’s possible of course that a massive breakout occurs from here but the crude ‘blow-off’ top look has me thinking the other way.
CADJPY WEEKLY
GBPAUD WEEKLY
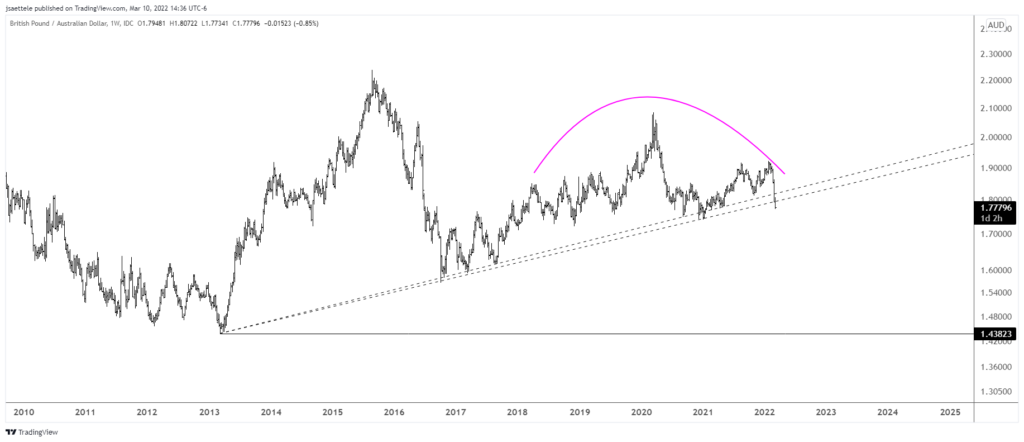
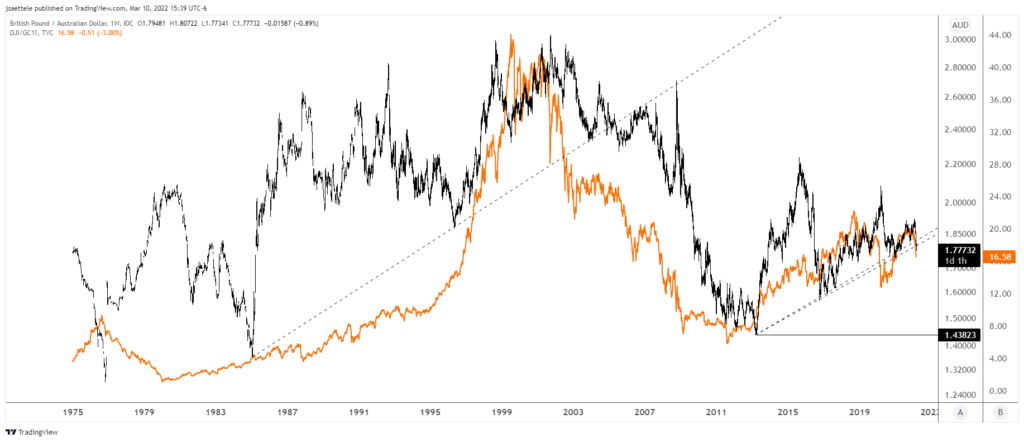
If GBPAUD closes down here tomorrow, then price will have broken a 9 year trendline. Also, a 4 year head and shoulders is visible. The technical implications are extremely bearish. I’ll revisit this if we do indeed close down here (or lower ) tomorrow. From a macro perspective, I’ve always looked at GBPAUD as a ratio of paper assets / hard assets. The chart below plots DJIA/gold along with GBPAUD. The implication is that a massive regime shift is underway.
GBPAUD (BLACK) AND DJIA/GOLD WEEKLY
