Market Update – July 24
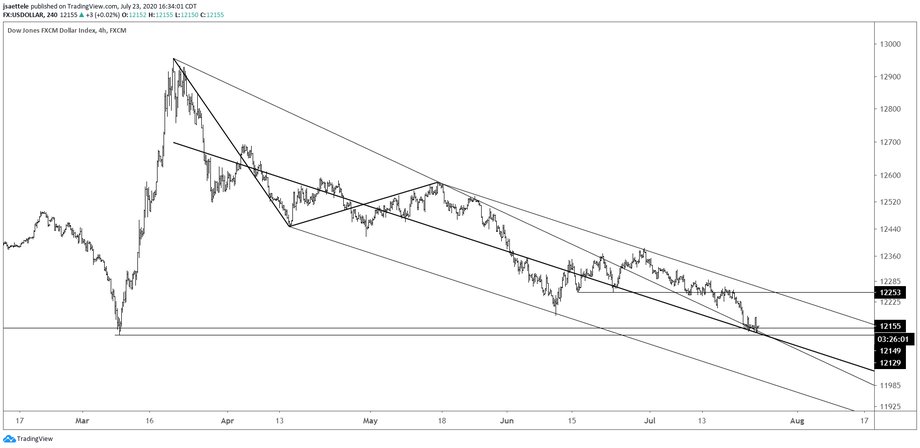
USDOLLAR 4 HOUR
USDOLLAR (EUR, GBP, AUD, and JPY) is testing a major level (daily chart is above). Price reacted today at the top side of the center line of the Schiff fork from the March high and the top side of the line off of the March and May highs. This is a great spot for a bounce. Pay attention to the upper parallel and former support at 12253. A break above there would indicate an important behavior change.
USDOLLAR DAILY

DXY DAILY

DXY reached the line off of the 2014 and 2018 lows today and also slipped under the March low. As detailed the last 2 days (see USD Sentiment Check), USD bearish sentiment is extreme and ripe for a reversal (also came across a USD poll today, which is below). Strength above 95.15 (high volume level…see below) would be my signal that the buck has reversed on at least a near term although my ‘bias’ is that 5 waves down from the March high are complete or nearly complete, which suggests a move back towards 97.85 (former 4th wave high).
7/19 – Seasonal tendencies are now bullish-sideways for DXY (and bearish-sideways for EURUSD) through mid-August. The biggest shift in seasonal tendencies however is in the commodity currency complex. AUDUSD and NZDUSD enter their most bearish period of the year starting now. USDCAD is in its most bullish period of the year. Nasdaq seasonal tendencies are bearish through August 14th. These charts are shown below.
U.S. DOLLAR INDEX FUTURES HOURLY

HSBC USD POLL

QQQ HOURLY

BIG test for QQQ at 255.45. This is the high volume level from 7/14 (highest hourly volume since 3/23, which was the low) and trendline from 4/21. A break would indicate an important behavior change (bearish). If price bounces within the channel, then the center line and VWAP from the high should be watched for resistance at near 261.
7/20 – I’m not sure what to say anymore when it comes to indices. NYSE breadth, for example, was negative today (more stocks down than up) but both the S&P 500 and Nasdaq were up. The Nasdaq was up A LOT thanks to MSFT and AMZN. In fact, AMZN accounted for 263% of the S&P 500 gain today. I guess nothing matters expect for the movements of the few companies with 1.5 trillion+ market caps but I’ll share the following observation anyway. QQQ made a volume reversal last week. The last 2 bearish ones nailed tops (no good before that though) and the bullish ones worked as well. I also view this area as important based on a long term trendline confluence. That means that this is a good place for something besides ‘up’ to happen.
SLV DAILY

Silver made a 2 day volume reversal today (high volume into a high followed immediately by high volume weakness). Specifically, volume on yesterday’s rally was over 3x the 20 day average. Volume on today’s decline was over 2x the 20 day average. This has occurred just 2 other times in the history of SLV; on 4/26/2011 and 9/26/2011. The first instance was 2 days before the all-time high. The second instance was an interim low (see below).
SLV DAILY

AUDUSD HOURLY

Watch for .7125 resistance now in AUDUSD. The center line of the channel from the 6/15 low is a possible bounce level near .7075. A break below opens up the lower parallel near .6980.
7/22 – The long term upper parallel in AUDUSD is still a bit higher, about .7230 now, but price did react to the underside of the trendline from the April low today and the upper parallel of the channel from the 6/15 low. We also had an 8 hour volume reversal today (see below). This is just the 7th such trigger in the last 5 years (bull and bear). There is a high volume level from today at .7125 (highest volume in exactly one month). Use that level as a reference point. Weakness below (session close, which is an 8 hour bar) would warrant a short entry.
NZDJPY DAILY

NZDJPY made a key reversal today (magenta bars indicate key reversals with a volatility filter). This is an interesting spot for a high given the parallel that has provided resistance a number of times over the last 2 years. Failure to top here risks a run into the upper parallel and January high at 73.35.


