Market Update: September 28
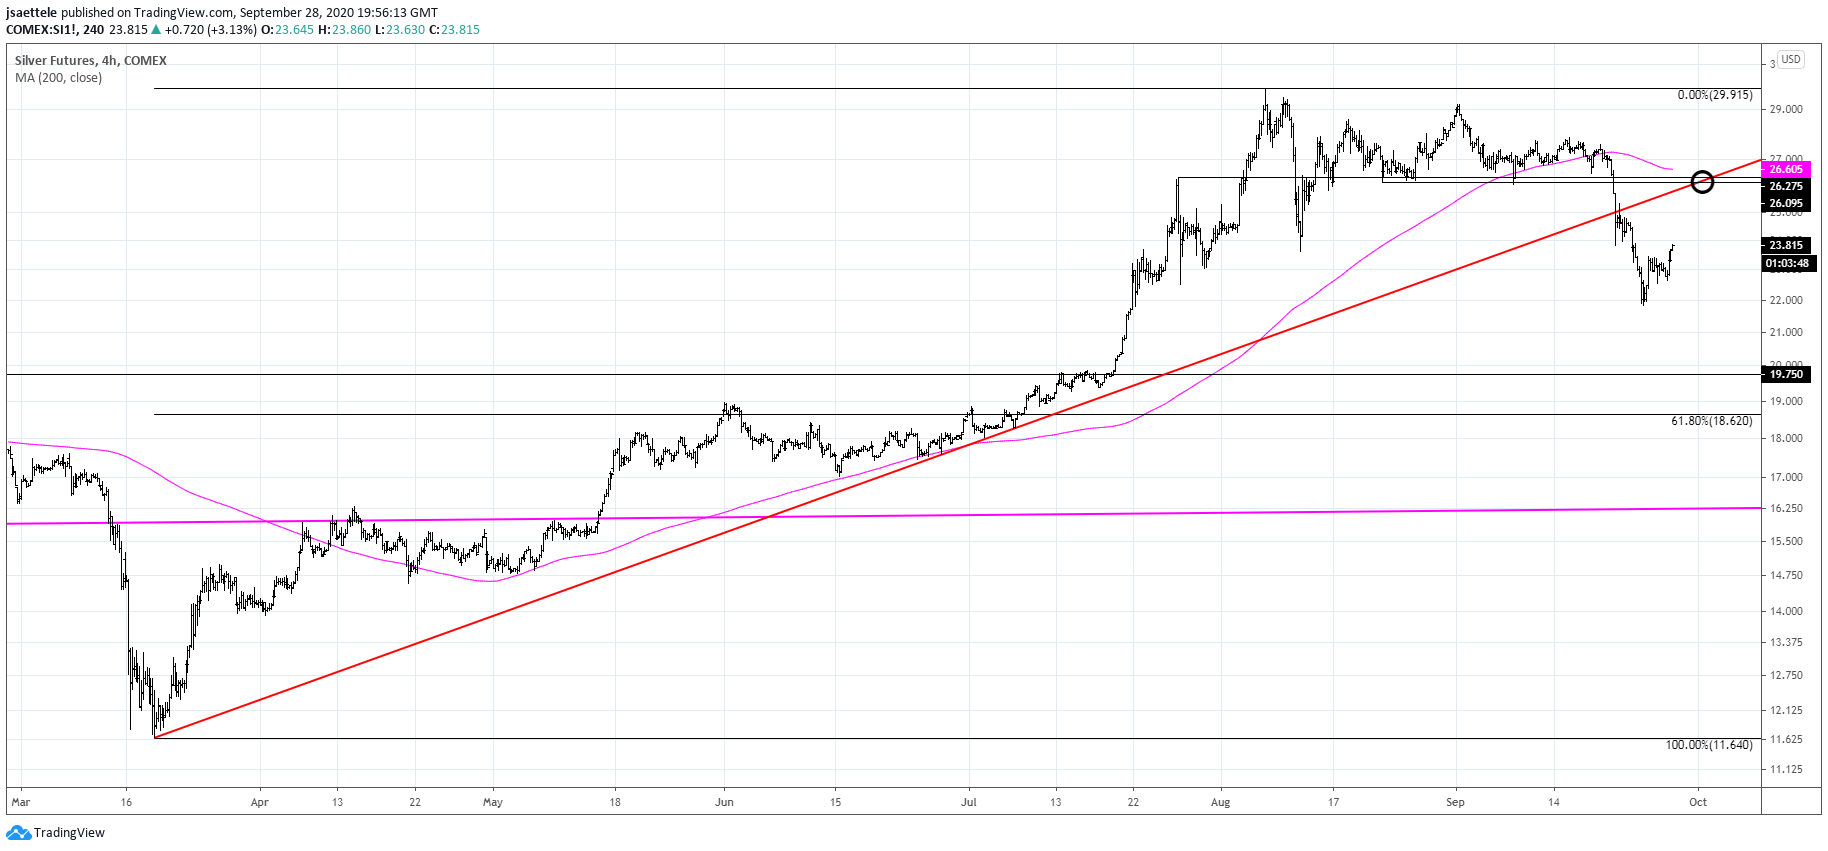
SILVER FUTURES 4 HOUR

Silver broke the trendline from the March low last week and is bouncing from short term oversold conditions. It would be quite a bounce but the underside of the noted trendline intersects the well-defined 26.10/28 zone late this week. If reached, I’d expect that level to provide resistance for another leg lower.
DXY 4 HOUR

DXY is starting to pull back from the well-defined 94.70. The top side of the neckline from the completed bullish head and shoulders pattern is ideal support near 93.50. I’m still bullish the USD but welcome a dip to that level to ‘reset’ the market for the next leg higher.
9/23 – DXY is nearing channel resistance from the March high near 94.70. The rally from the low would consist of 2 equal legs at 94.61 so 94.60/70 is a zone to pay attention to for resistance. Proposed support is 93.66/99. I remain of the mind that more important resistance is the red parallel near 96.50 (see chart below for a zoomed out view).
EURUSD 10 MINUTE

Going REALLY short term today on EURUSD. A slight push higher from current levels would complete a 5 wave rally and probably compose wave A of a 3 wave advance. A B wave pullback would then be expected into 1.1640 or so before a C wave higher completes the corrective advance into 1.1720/50. Bottom line, I maintain that strength should be sold.
9/24 – Not much change regarding EURUSD. Price did bounce near 1.1630 and resistance should be between 1.1720 and 1.1775 if reached. This zone has been an important pivot since July. Downside focus remains 1.1450-1.1500. Be aware that a break below the median line would likely lead to downside acceleration towards the target zone.
AUSTRALIAN DOLLAR FUTURES 8 HOUR

Several 8 hour volume reversals have occurred in AUDUSD (futures) the last 2 trading days. As this chart shows, previous reversals have led to at least a a pause in the underlying move (down) in recent years. As noted last week, this is a possible bounce area anyway. That thought is reinforced by the fact that the year open price is .7015 (see below chart). Given the volume reversal and year open, respect potential for a bounce back to the 50 day average and 9/9 low at .7190. Former support at .7135 is also possible resistance.
9/23 – .7030/65 is a possible bounce area for AUDUSD. This zone was resistance and June/July and support on 7/24. If price does bounce, then resistance should be about .7130, which is former support and the underside of the former channel corrective support line. Long time readers know this setup as the ‘slingshot’. Broad downside focus remains .6680.
AUDUSD DAILY

BRITISH POUND FUTURES DAILY

GBPUSD has responded to 2020 VWAP. The top side of the just broken resistance line (see below chart) is proposed support along with Friday’s uncovered close at 1.2740. 1.3005/50s is a well-defined zone for resistance. This zone includes support from August and resistance from earlier this month.
9/22 – Cable is nearing the mentioned 1.2580. Resistance from April at 1.2650 is also VWAP from the March low (see futures chart below). In general, be aware of 1.2550-1.2650 as a possible support zone. 1.2865/85 is near term resistance.
GBPUSD HOURLY


