Market Update – June 1
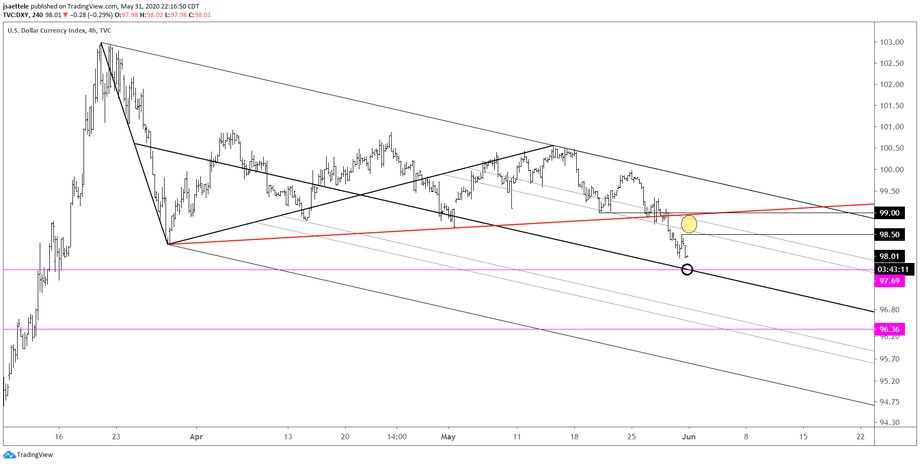
DXY 4 HOUR
DXY is breaking down but pay attention to 97.69 for possible support. This is the November 2018 high and center line of the channel from the March high. If price bounces from there then resistance is likely in the 98.50-99.00 zone.
USDOLLAR DAILY

The other USD index that I follow, USDOLLAR, is nearing the noted 12347. Another level that I would be aware of for a possible bounce is the December 2018 high at 12375. The underside of the 2011-2014 trendline (magenta line) is likely resistance near 12480.
5/26 – USDOLLAR found resistance at the cited level (recovery high was 12536) and broke down today. Individual USD crosses nailed their supports as well (see levels noted below from last week). My wave count interpretation is that weakness from the 5/18 high is either a 3rd or C wave so downside potential is significant in the coming weeks and months. Near term levels to pay attention to are 12415 and 12347 for supports and 12466/79 for resistance.
AUDUSD DAILY

AUDUSD has taken out the critical .6680 level, which has been significant since August 2019. As long as price is above this level, focus is on the gap from 1/24 at .6823. This is also the top of the short term channel that we’ve been following. Generally, .6800-.6900 is an important zone defined by parallels within the channel from the 2011 high (see weekly chart below) and should be watched for resistance.
AUDUSD WEEKLY

NZDUSD HOURLY

NZDUSD is trading at the center line of the channel from the March low, which has been resistance since 5/20. The 9/3/2019 low is in line with the 61.8% retrace of the decline from the December high at .6269 (see longer term chart below). So, beware of resistance up to .6269. If price pulls back, then proposed support is the 25 line near .6150.
NZDUSD DAILY

EURUSD 4 HOUR

EURUSD is trading just above the channel from the 2019 high so immediate focus is on 1.1200. Watch for support from the top of the channel and center line of the channel from the March low, which is 1.1075/95. If that fails to hold, then the noted 1.1020 is the next spot to consider longs.
5/28 – EURUSD is testing a massive level defined by the top of the channel from the January 2019 high and median line of the bullish channel. A break above would likely lead to upside acceleration (median line acceleration) into 1.1200 (75 line within the channel). If that happens, then the topside of the channel and median line would become support. If price pulls back now, then support should be former resistance at 1.1020.


