Market Update: September 29
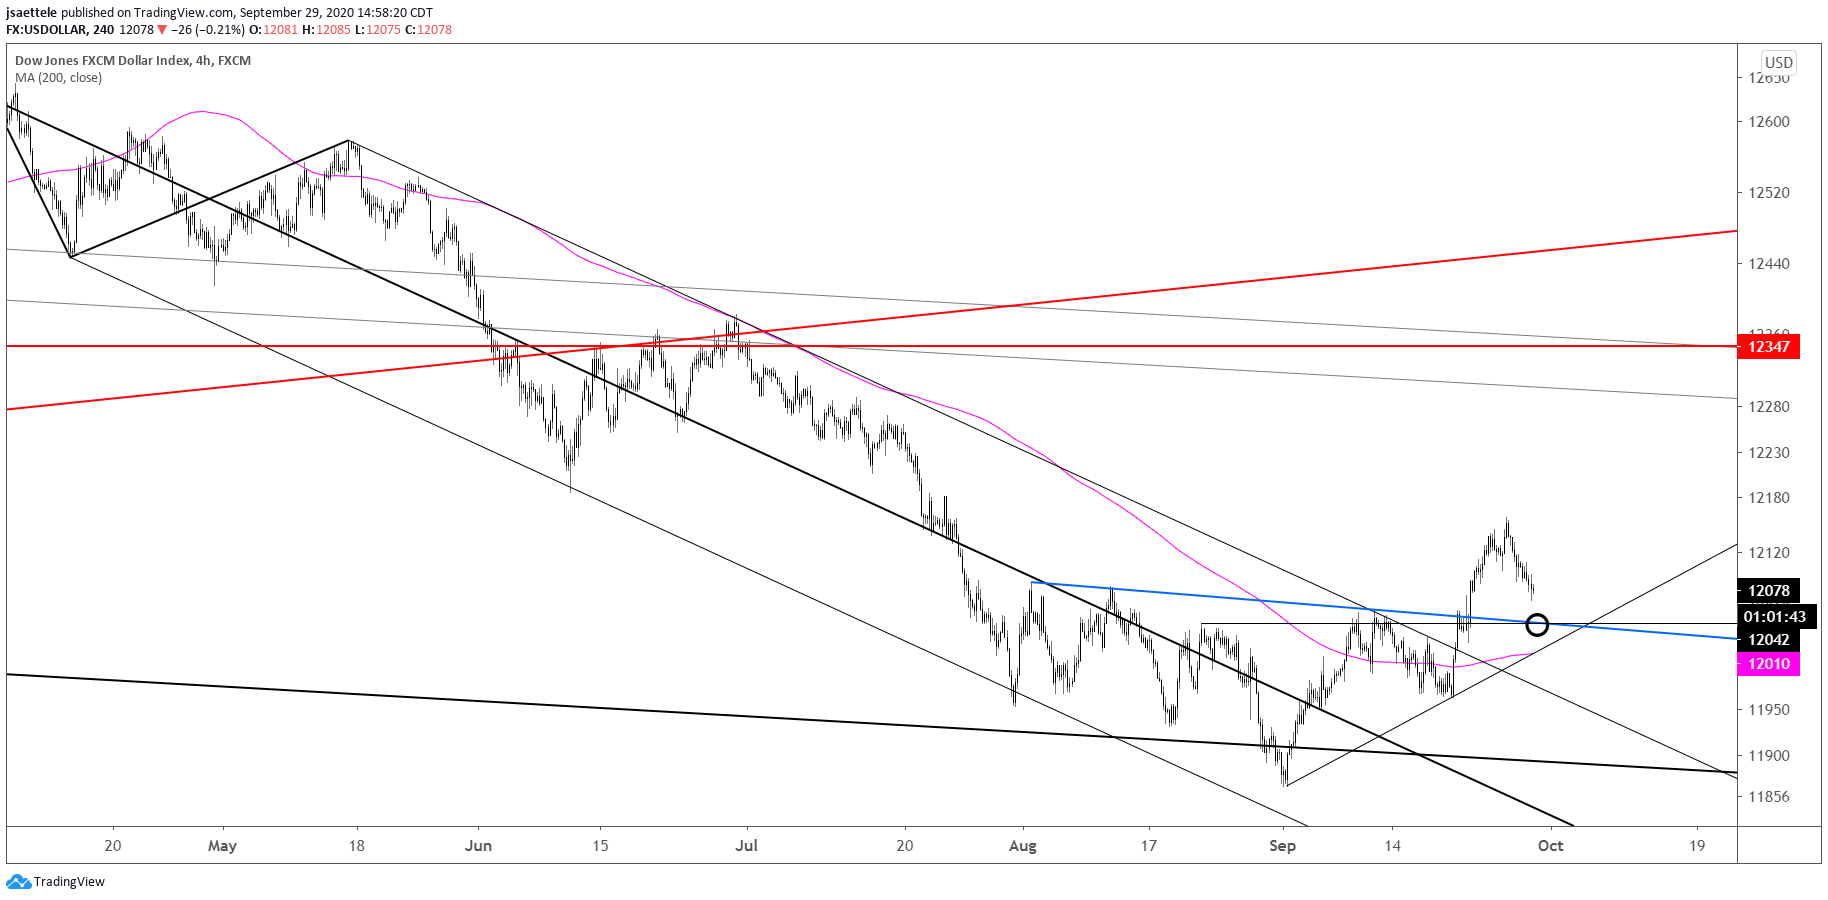
USDOLLAR 4 HOUR

We looked at DXY yesterday, remember that the neckline is 93.50 and proposed support for that index. USDOLLAR is nearly identical with the neckline near 12040. I’m in the re-test of the breakout level (neckline) and then higher for the USD.
9/23 – USDOLLAR has traded into potential resistance at 12129. I remain constructive but this is a good spot for a pause. Watch for support now in the 12057/87 zone.
WYCKOFF DISTRIBUTION SCHEMATIC

We last looked at the Wyckoff Distribution Schematic on 9/14 (see here). To review:
I’m showing a Euro futures chart (see below) because volume must be incorporated when analyzing a market from a Wyckoff perspective. Volume on SOW (sign of weakness) days are highlighted with yellow circles. Notice how volume expanded into the BC (buying climax) and decreased on the ST (secondary test). A drop below 1.1750 is required in order to complete the distribution.
BC—buying climax. Marked increases in volume and price spread. The force of buying reaches a climax, with heavy or urgent buying by the public being filled by professional interests at prices near a top.
AR—automatic reaction.
ST—secondary test.
SOW—sign of weakness. Indicates a change of character in the price action: supply is now dominant.
LPSY—last point of supply. LPSYs represent exhaustion of demand and the last waves of large operators’ distribution before markdown begins in earnest.
UTAD—upthrust after distribution. Analogous to springs and shakeouts.
We can now label LPSY. Resistance should register between now and 1.1780s. Watch for signs that price is rolling over again (volume reversal, long upper wick on hourly or 4 hour chart, etc.) before adding to the short position. An updated futures chart with Wyckoff labels is below and the updated spot chart is 2 charts down.
EURO FUTURES DAILY

EURUSD 4 HOUR

AUSTRALIAN DOLLAR FUTURES HOURLY

AUDUSD has traded into former support at .7135 but respect potential for strength into .7190-.7220 before this rolls over. Again, the 9/9 low is .7190. VWAP from the high is currently .7220 and in line with the upper parallel of the short term bearish fork. A pullback into .7080/90 maybe in order before strength into .7190-.7220. I’m willing to buy that pullback and before flipping short at the noted higher zone. On spot (see below), the 200 period average on the 4 hour chart is currently .7230. I’ve shown a rolling monthly midpoint 2 charts down, which is currently .7190. Notice how AUDUSD has been riding this midpoint all year! Bottom line, the weight of evidence suggests that .7190-.7220 is a barrier to strength.
9/28 – Several 8 hour volume reversals have occurred in AUDUSD (futures) the last 2 trading days. As this chart shows, previous reversals have led to at least a a pause in the underlying move (down) in recent years. As noted last week, this is a possible bounce area anyway. That thought is reinforced by the fact that the year open price is .7015 (see below chart). Given the volume reversal and year open, respect potential for a bounce back to the 50 day average and 9/9 low at .7190. Former support at .7135 is also possible resistance.
AUDUSD 4 HOUR

AUDUSD 4 HOUR

NEW ZEALAND DOLLAR FUTURES HOURLY

NZDUSD is into .6600 so price could turn down now but as is the case for AUDUSD, respect additional upside until .6640. This is the top of the short term corrective channel, 200 period average on the 4 hour chart, and 9/11 low. The level was also support on 9/22 before the break. A dip prior to obtaining .6640 could see support at .6560/70. The spot chart is below.
9/27 – Friday’s spike didn’t quite reach .6600 (high was .6592) but additional upside/sideways may be in order with futures (see below) testing VWAP from the May low. In fact, we may be trading VWAPs for the next few months in Kiwi. If price does bounce a bit more, then VWAP from the high reinforces resistance just above .6600. Potentially major support for a higher low against the March low is the combination of 2020 VWAP and VWAP from the March low near .6370, which is in line with June support at .6380!
NZDUSD 4 HOUR


