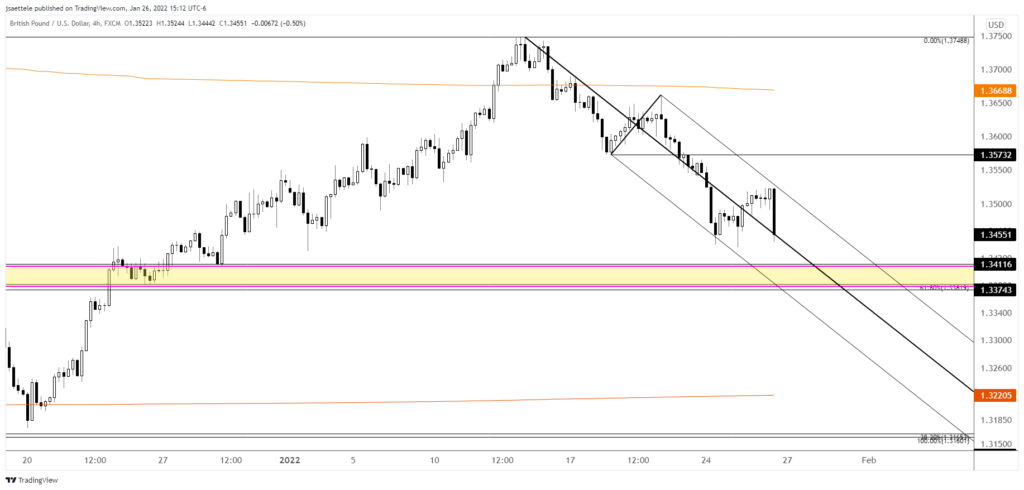
Market Update 1/26 – GBPUSD Nearing Support Zone
SPX HOURLY
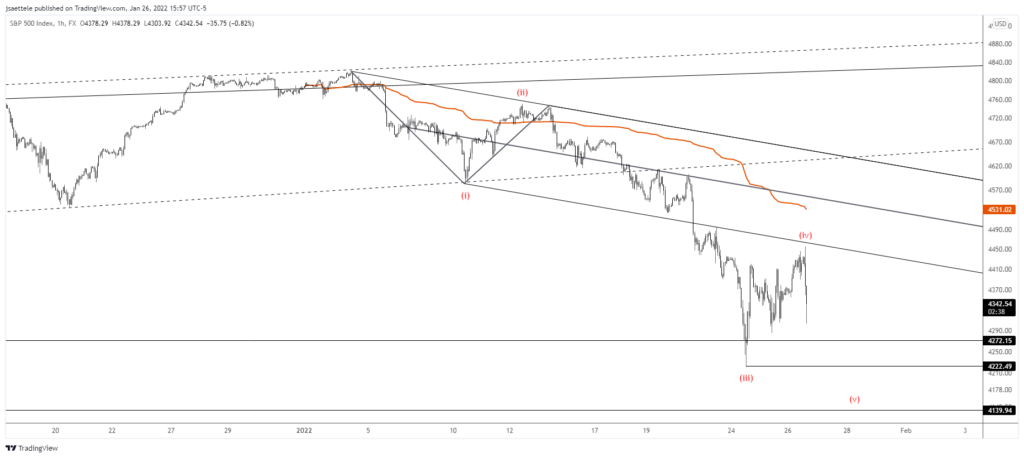
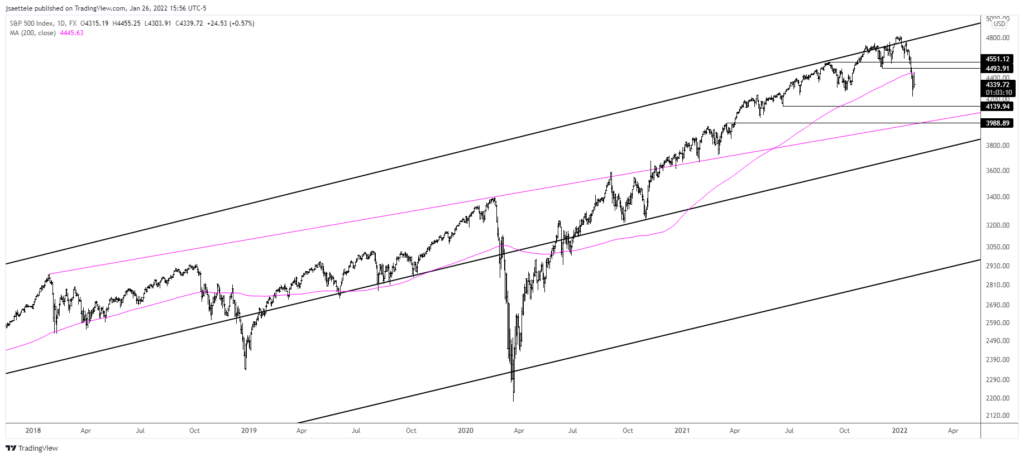
My view is that a 4th wave price extreme is in place for SPX at today’s high. That doesn’t mean however that it’s straight down from the current level. 4th waves are usually sideways affairs such as triangles. As such, respect potential for volatile sideways trade before a 5th thrust to a new low. Levels to consider (eventually) for a 5th wave low are 4140 and 3990. The latter levels seems aggressive but be aware of the level because it’s the top side of the line that originates at the 2018 high (see magenta line on chart below) and the extension of the 4th wave range.
4th wave range is 4455-4222 = 233
range extension = 4222-233 = 3989
1/24 – SPX took out the October low before staging a dramatic reversal and closing slightly higher on the day. I’m watching for resistance near 4480. This is the underside of the former corrective channel…the line was resistance on Friday. From an Elliott perspective, my view is that this is a 4th wave rally. The implication is that price tests today’s low (late this week or early next?) in a 5th wave drop.
SPX DAILY
SPOT GOLD 4 HOUR
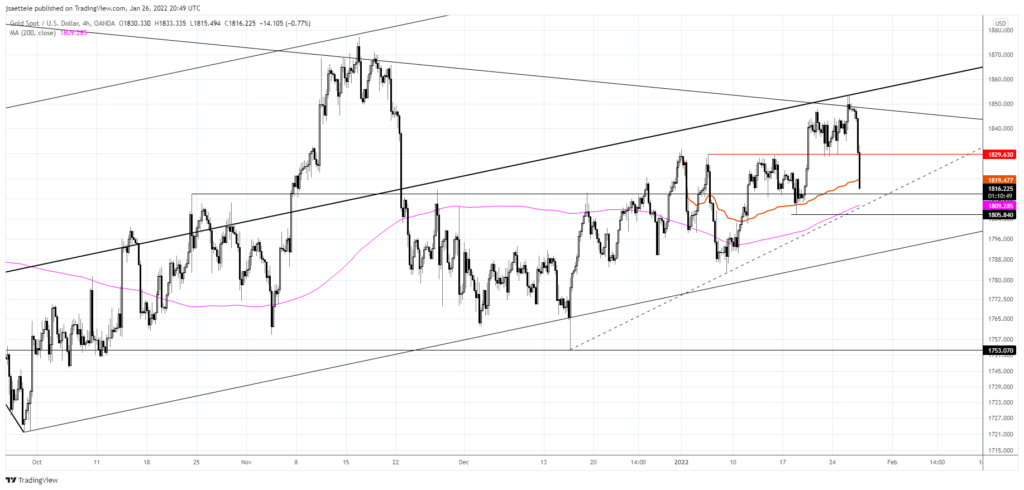
Gold dumped off of resistance and is into the proposed support zone of 1805/20. The top side of the zone is 2022 VWAP. The bottom of the zone is the 1/18 low, 200 day average, and 50 day average. A short term trendline is just above that level. The well-defined 1814 is also in the vicinity. Bottom line, watch for a show of support.
1/25- Gold is testing the noted 1850 and massive breakout level from the trendline that originates at the January 2021 high. This is also the median line from the bullish Schiff fork. A break above should lead to accelerated strength to 1920. If price pulls back then support should be 1820.
USDOLLAR 4 HOUR
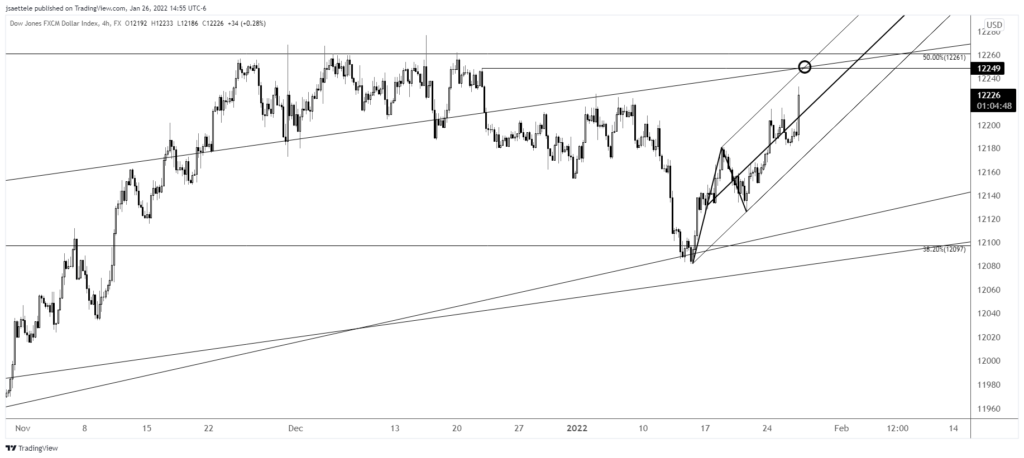
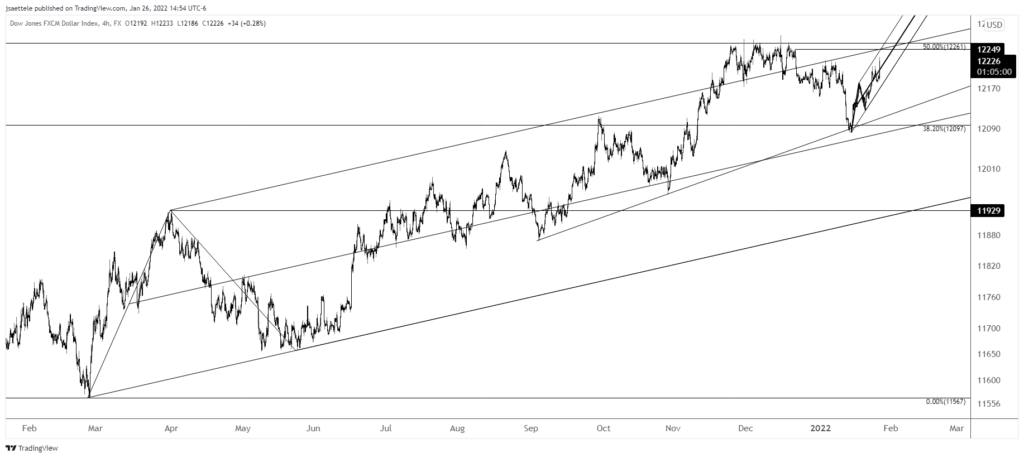
The USD ripped higher today on FOMC. If action since December is a topping process then 12250 is probably resistance. This is the top of a short term channel and the upper parallel of the channel from the 2021 low. A zoomed out chart is shown below.
USDOLLAR 4 HOUR
GBPUSD DAILY
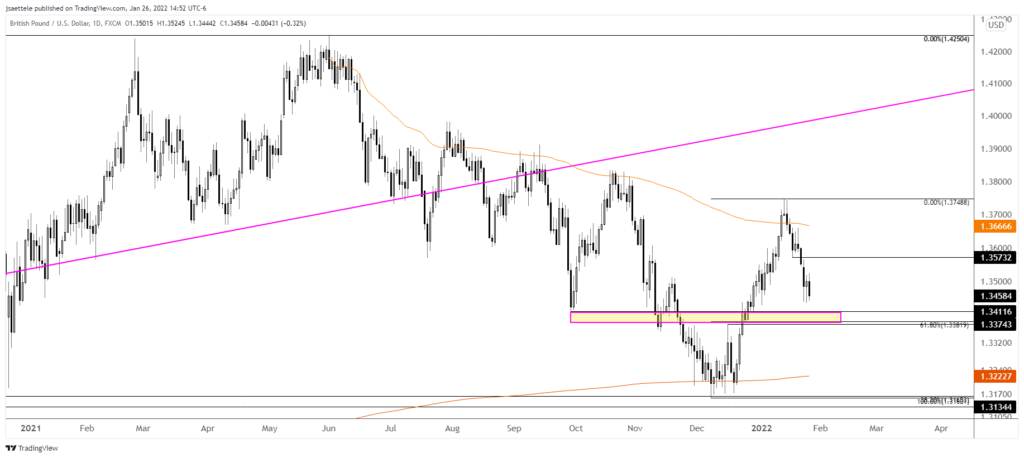
Pay attention to 1.3375-1.3410 in GBPUSD for support. The zone is defined by the 12/16 high, 61.8% retrace of the rally from December, and September low. The bottom of the zone also intersects with the lower parallel of the short term bearish fork (see 4 hour chart below).
GBPUSD 4 HOUR
