Market Update – July 23
MARKETWATCH HEADLINE
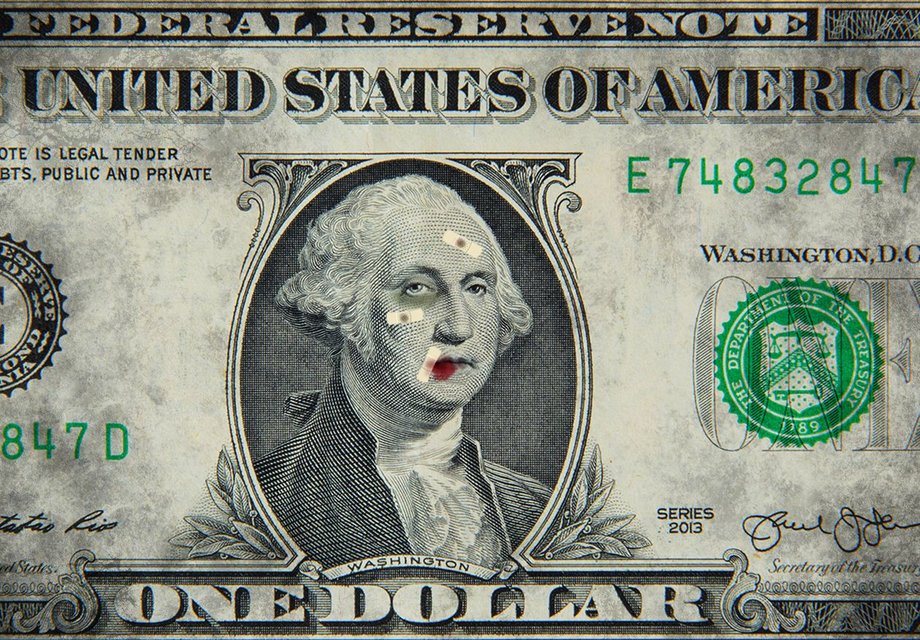
THE U.S. DOLLAR IS GETTING PUNCHED IN THE MOUTH, AND ITS OUTLOOK AMID CORONAVIRUS DOESN’T LOOK GREAT, SOME EXPERTS SAY
This article from Marketwatch was published late on Tuesday. The text and imagery is textbook sentiment extreme (literally textbook, there are chapters devoted to this stuff in my book, Sentiment in the Forex Market). The active language, ‘punched in the mouth’ indicates an extreme. The extrapolation of current trend, ‘outlook doesn’t look great’, indicates an extreme. The blood on George’s mouth and bandaids on his face also indicate an extreme. Bottom line, USD bearish sentiment is extreme and markets reverse from sentiment extremes.
COPPER HOURLY

Copper made another bearish outside day today (there was one on 7/15 too). Price continues to hold the center line but if it breaks then expect downside acceleration until the lower parallel, which is now about 2.78.
7/15 – This is a massive level for copper. That simple. Price made a bearish engulfing pattern today and a long term trendline and major horizontal level. This combination makes me favor the downside. Near term, continue to be aware of the median line and lower parallel of the channel from the March low (see below). The center line is about 2.86 now and the lower parallel about 2.73.
AUDUSD 4 HOUR

The long term upper parallel in AUDUSD is still a bit higher, about .7230 now, but price did react to the underside of the trendline from the April low today and the upper parallel of the channel from the 6/15 low. We also had an 8 hour volume reversal today (see below). This is just the 7th such trigger in the last 5 years (bull and bear). There is a high volume level from today at .7125 (highest volume in exactly one month). Use that level as a reference point. Weakness below (session close, which is an 8 hour bar) would warrant a short entry.
7/21 – AUDUSD has reached the 61.8% retrace of the decline from the 2018 high at .7131. This level is bolstered by the May and December 2016 lows. I’m on alert for a reversal either now or from the upper parallel of the channel from the 2011 high / 200 week average at .7230/60.
AUSTRALIAN DOLLAR FUTURES 8 HOUR

AUSTRALIAN DOLLAR FUTURES 8 HOUR

USDJPY DAILY

USDJPY has been contracting for 3 months in what’s taken the shape of a triangle. Triangles tend to (not always) serve as continuation patterns. Since the move prior to the triangle was up, I’m mentally prepared for another bull leg in USDJPY. There is a high volume level from Tuesday at 106.91. Watch that for support. 108.70s remains a near term upside level. Timing wise, I like long against the recent range low (106.67). The red and blue dots on the chart below indicate inside bars at the upper and lower Bollinger bands (2 standard deviation from the 20 day average). I noticed years ago that this setup tends to occur at pivots. Bigger picture, USDJPY is in position to make a massive move. The magenta dots 2 charts down indicate when Bollinger band width (difference between the bands) has been at least as low as the current reading. Extremely tight bands tend to occur towards the end of consolidation and before a trending move.
7/20 – USDJPY continues to hold up and there is no change to the 107.70 initial target with potential for 108.70s. Risk on longs is now breakeven (107.00). Be aware of a high volume level now at 107.39 (from Monday’s Asian session). If that price is taken out then I’d pay attention to it for support.
USDJPY DAILY

USDJPY DAILY

GBPUSD DAILY

GBPUSD still looks great. I am concerned about USD sentiment but risk is today’s low, which is well-defined and small. The April (1.2648) was resistance earlier this month and was support today. Price also closed over the 200 day average today. I like both of those things. The high volume level from today at 1.2675 and 200 day average at 1.2698 provide a range for support. Upside focus is the median line, currently near 1.2975.
7/20 – GBPUSD looks great and support should be 1.2625 now on its way to the June high at 1.2814 and possibly the longer term median line near 1.2960. What ‘annoys’ me is the extreme sentiment towards the USD generally (a lot of bears out there…DXY speculative shorts are the highest in over 7 years). It’s possible though that GBPUSD holds up and EURUSD doesn’t (Euro is 57% of DXY), which brings me to EURGBP.
GBPAUD WEEKLY

Long Cable and short Aussie? It would make sense from the current level. GBPAUD reached the 61.8% retrace of the rally from October 2016 and the 200 week average today. Big level. The daily candle sports a long lower wick as well. Based on these observations, this is a good spot to take a bullish view on GBPAUD (long GBP, short AUD).
GBPCAD 4 HOUR

No change to GBPCAD. The possible head and shoulders bottom remains in play. The bullish trigger is 1.7175. The measured objective from the pattern (if confirmed) is 1.7600.
7/19 – USDCAD (not shown) is trying to break above channel resistance from the March high and I remain constructive GBPUSD so I thought that it would be interesting to look at GBPCAD. I did…and it is interesting! A nearly 2 month head and shoulders bottom may be in the works and price held the trendline from the August 2019 low. The neckline for a breakout is 1.7175 but I’m constructive while above 1.6940. There is a short term trendline near 1.7120 early in the week that is worth monitoring for a breakout.


