Market Update 6/30 – Big EURUSD Level at 1.1770
DXY DAILY
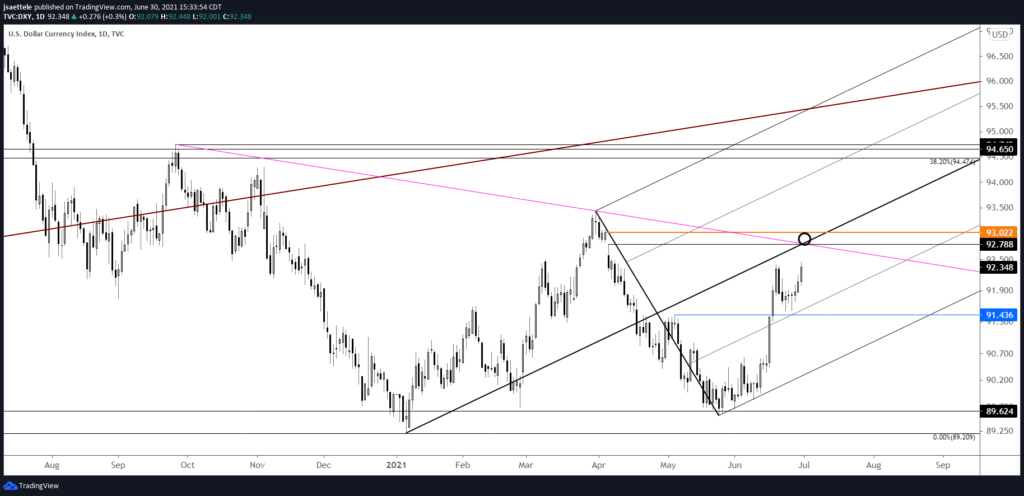
Near term DXY upside focus is 92.79-93.02. The zone is defined by the median line of the fork that begins at the January low and the uncovered close from 4/5. It’s also the line off of the September and March highs. A break above would be extremely bullish given the STILL crowded short USD position. I’ll zoom in as price approaches the level but my initial thinking is that DXY completes a 5 wave rally into the noted zone and pulls back.
EURUSD DAILY
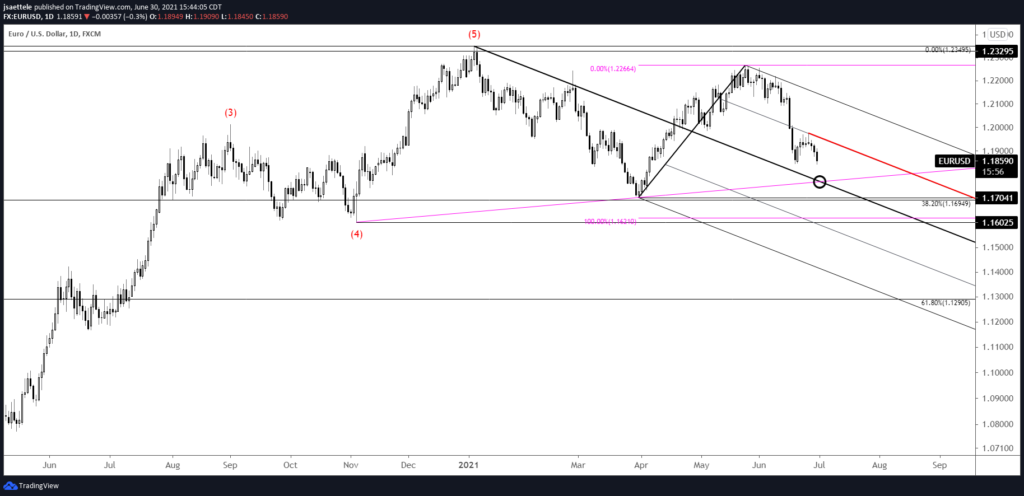
EURUSD is in the exact opposite position as DXY. That is, the line that extends off of the September and March lows intersects the median line from the fork that originates at the January high. That intersection is about 1.1770. A break below there would be extremely bearish. The red parallel (25 line) is now resistance. That line is currently about 1.1950 about 6 pips per day.
GBPUSD DAILY
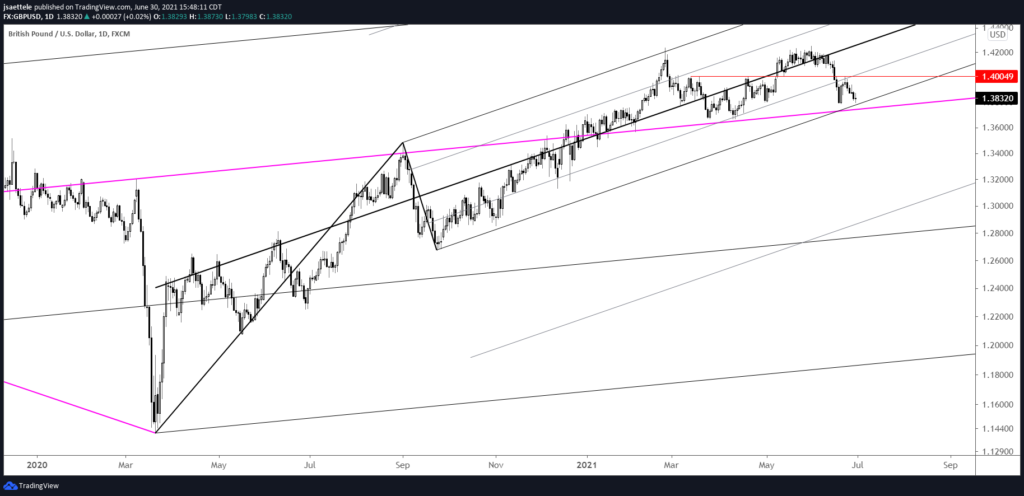
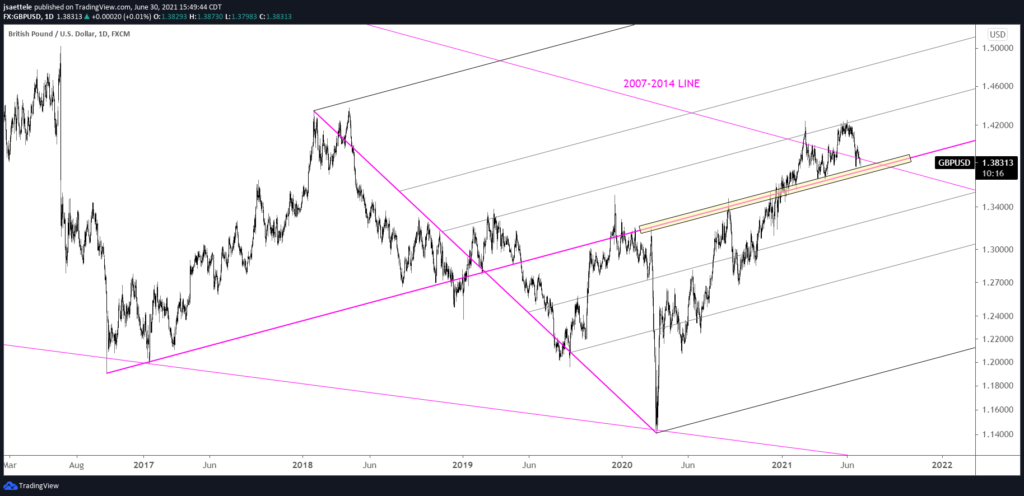
GBPUSD is nearing decent support. A drop under 1.3786 would make the drop from 6/1 in 5 waves and set the stage for a corrective recovery. 1.3740/86 is a well-defined zone for support. The bottom of this zone is the median line that originates at the 2016 low (magenta line…see highlighted below).
GBPUSD DAILY
USDJPY DAILY
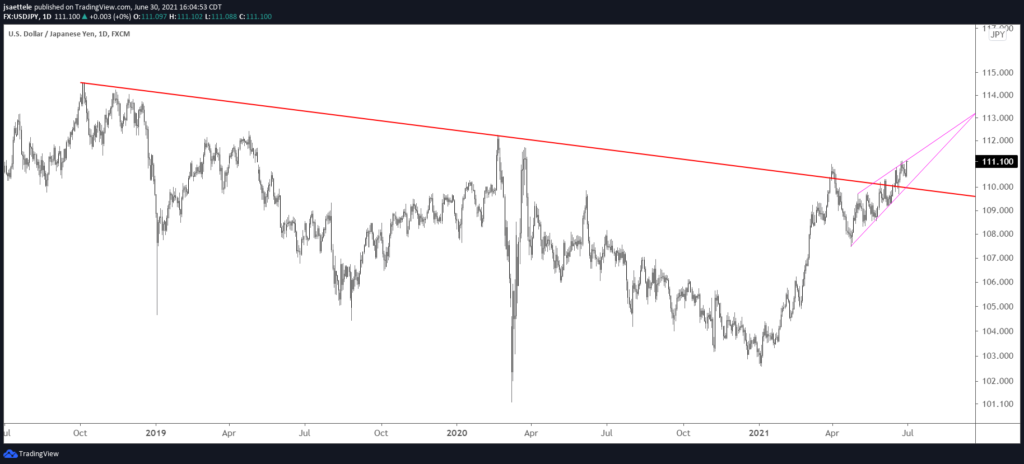
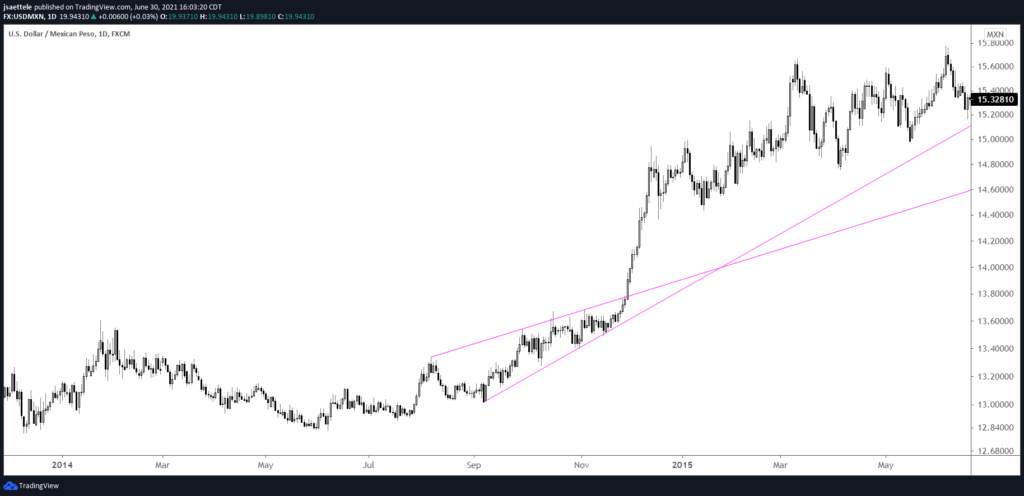
Is USDJPY about to go parabolic? Price is well above the trendline from the 2018 high and action since the April low is a possible running wedge. Running wedges occur when price breaks above the upper wedge barrier. When that happens, the rally tends to accelerate. One example I recall is USDMXN in 2014 (see below). Bottom line, a close above the upper wedge barrier in USDJPY would warrant a long position.
USDMXN DAILY (2014)
