Market Update 3/9 – Nasdaq Holds and Crude Oil Reverses
CRUDE OIL WEEKLY
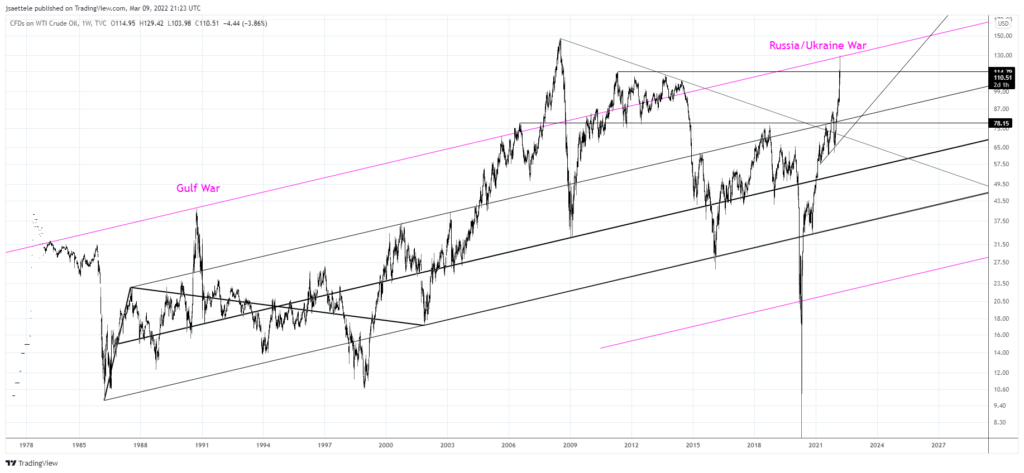
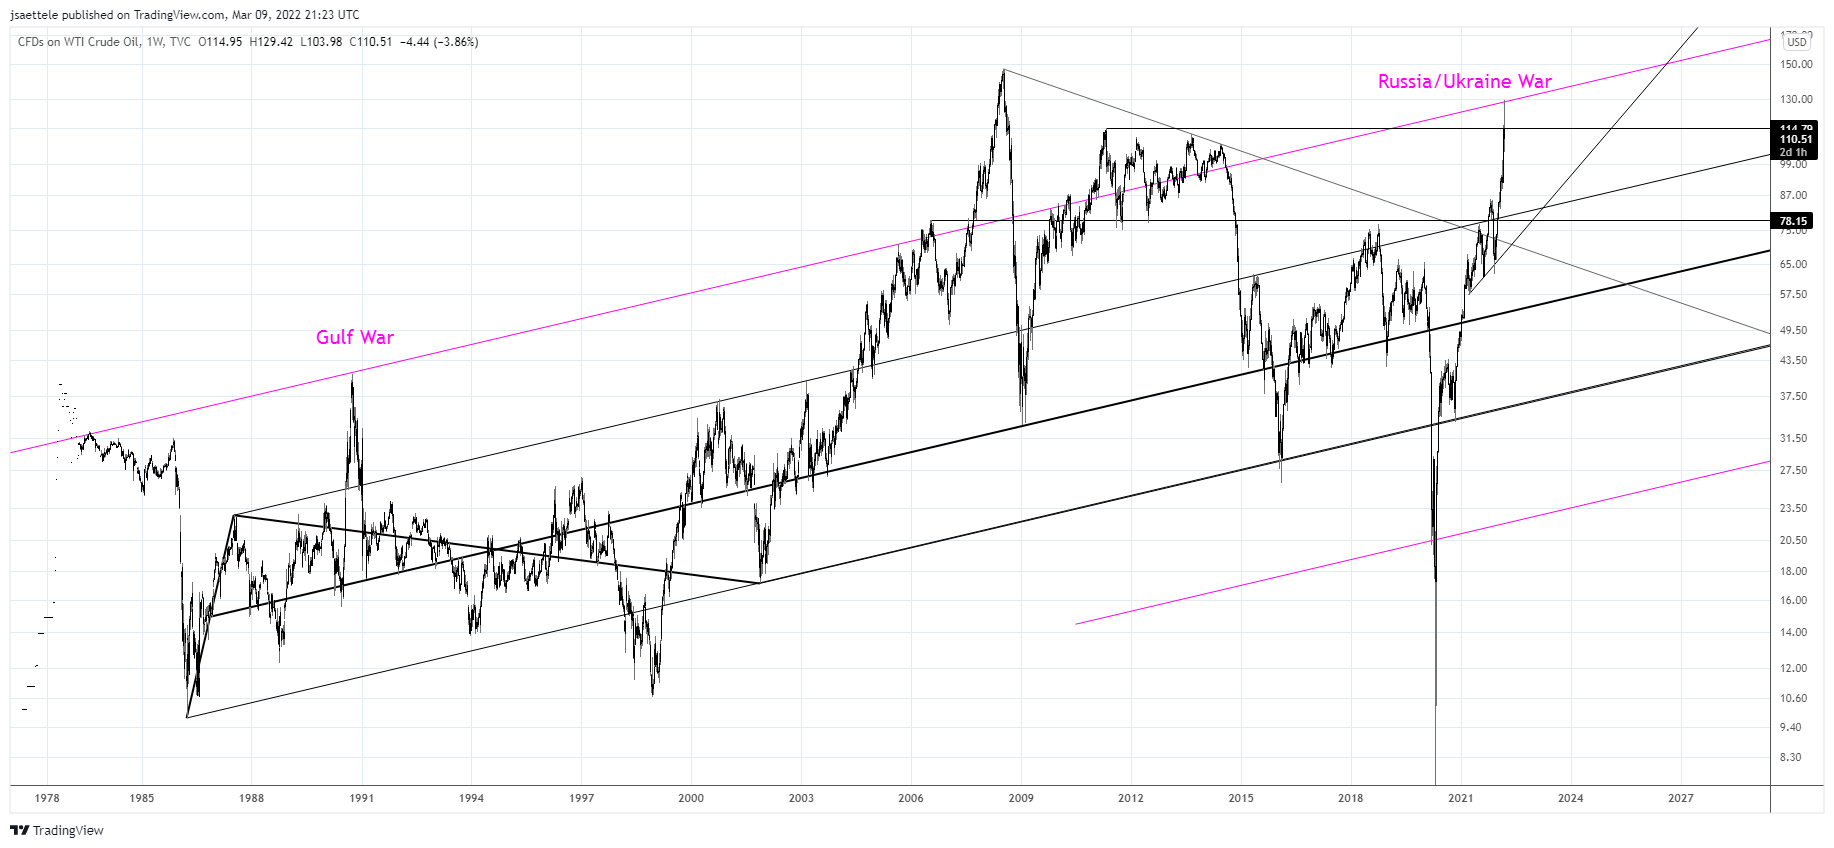
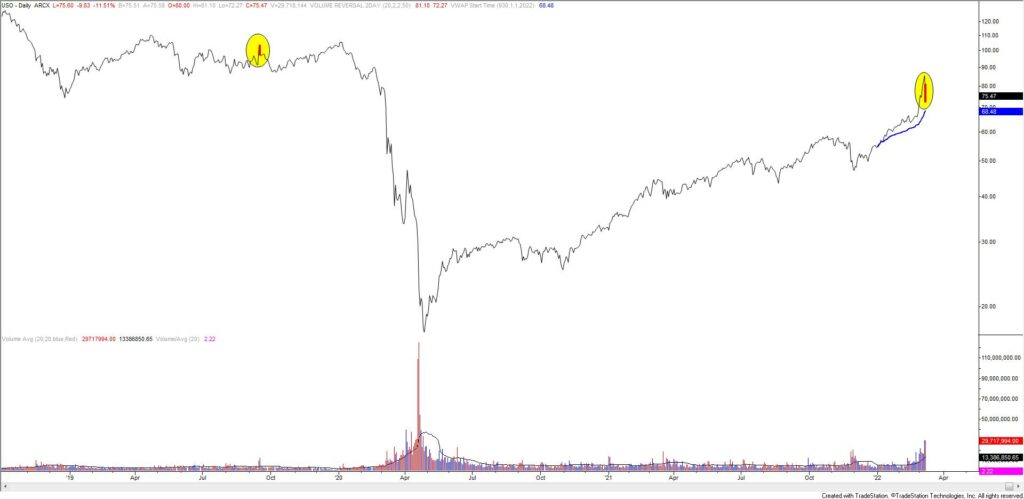
That was a blowoff top in crude oil. Interestingly, resistance came in at the same parallel that nailed the Gulf War high in 1990. I’m not going to get into detail on the near term charts just yet other than noting 97.60s for support and 115.50 for resistance. Also, USO completed a high volume 2 day reversal. This last happened in September 2019 (see below).
USO DAILY
NASDAQ FUTURES (NQ) DAILY
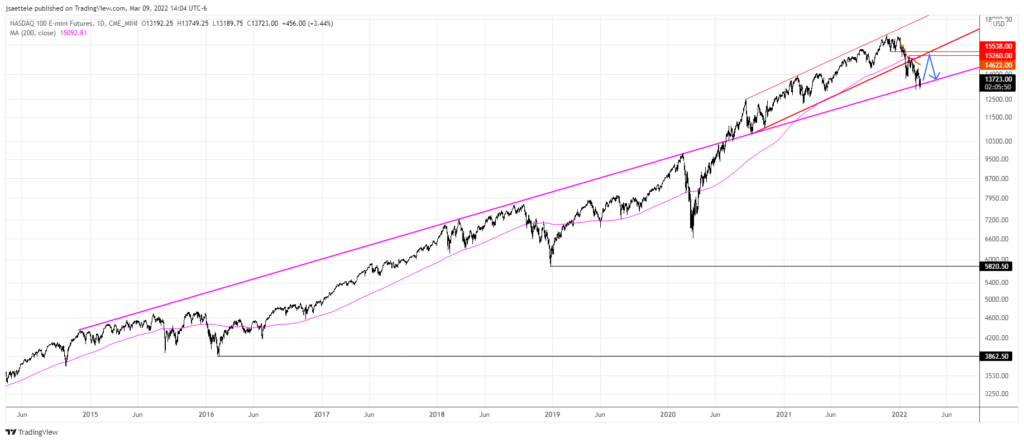
NQ held the top side of the line that originates at the November 2014 high. This line crosses highs in 2018 and 2020, and lows in 2020. It was also support on 2/24. I’m ‘thinking’ that price attempts a recovery back into 15000+. There’s a lot up there for resistance, including the underside of former channel support, the 200 day average, and the 61.8% retrace.
SPOT GOLD 4 HOUR
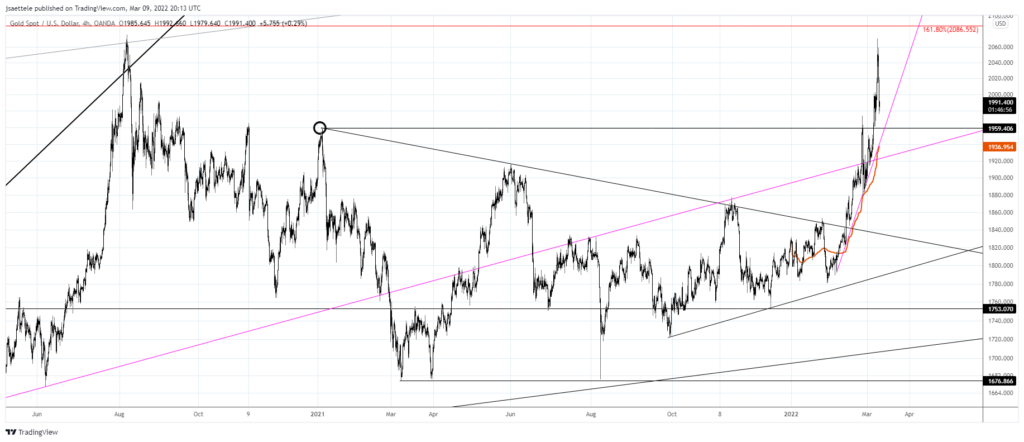
Gold is pulling back following a breakout…so watch for support! There are several levels to know for support; the January high at 1959, the short term trendine near 1940 (2022 VWAP is 1938) and the magenta parallel near 1922.
SPOT SILVER 4 HOUR
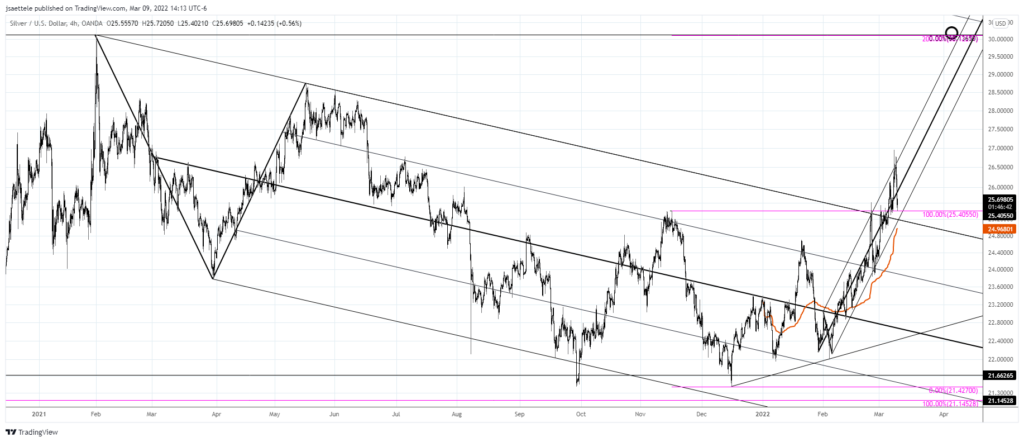
Silver is also pulling back post breakout. The silver chart is actually a bit cleaner than the gold chart (which is rare in my experience). The top side of former channel resistance intersects with the lower parallel from a bullish fork near 25.19. 2022 VWAP is just below that level.
3/1 – Silver broke above its 13 month channel today to join gold. The top side of the channel at 24.87 is now support. The objective is the 2021 high and full channel extension at 30.14. Gold support should be 1922/28 now.
EURUSD 4 HOUR
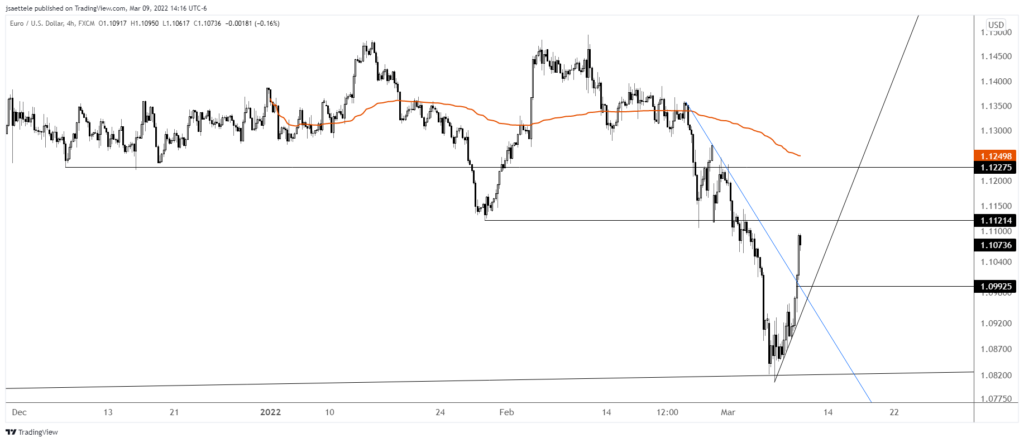
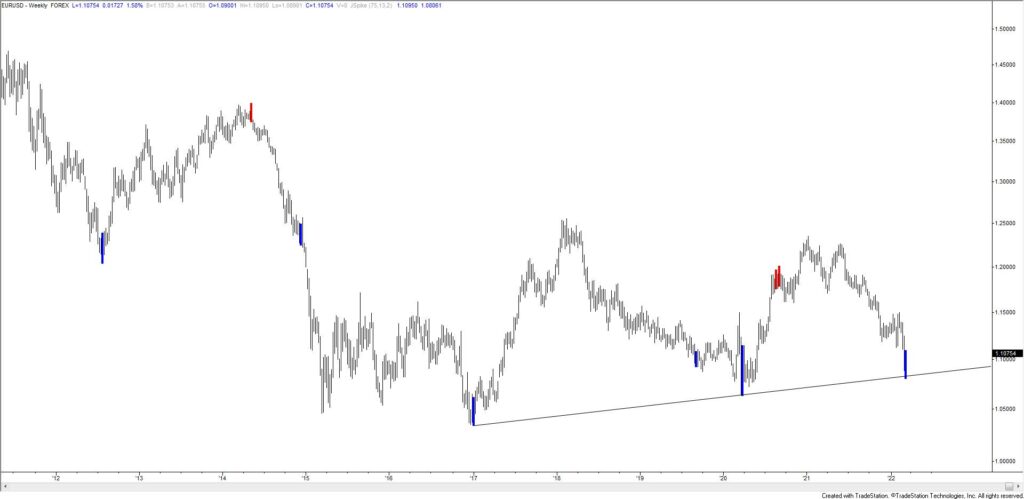
EURUSD has broken above the short term upper parallel (shown on this chart in blue). The top side of that line is now support. The line is 1.0980-1.1000 throughout Thursday. Former lows at 1.1120 and 1.1230 are possible resistance levels. The latter level is reinforced by 2022 VWAP. I’m of the mind that a major low is in place for EURUSD. Remember the trendline posted earlier this week? The chart below shows this line along with proprietary reversal signals. A signal will register this week, assuming we hold up of course.
3/8 – FXE (euro ETF) completed a 2 day volume reversal today. This means that the prior day was a high volume down day and today was a high volume up day. Previous instances are highlighted. Most signals have been reliable. Near term, the important test remains the upper parallel from the short term fork, now near 1.1040. If EURUSD is going to recover then I’d think that 1.0885 provides support.
Trade on mobile with cTrader
cTrader is one of the world’s leading trading platforms, with versions available in web, desktop, iOS, and android.
Learn more
EURUSD WEEKLY
USDSEK DAILY
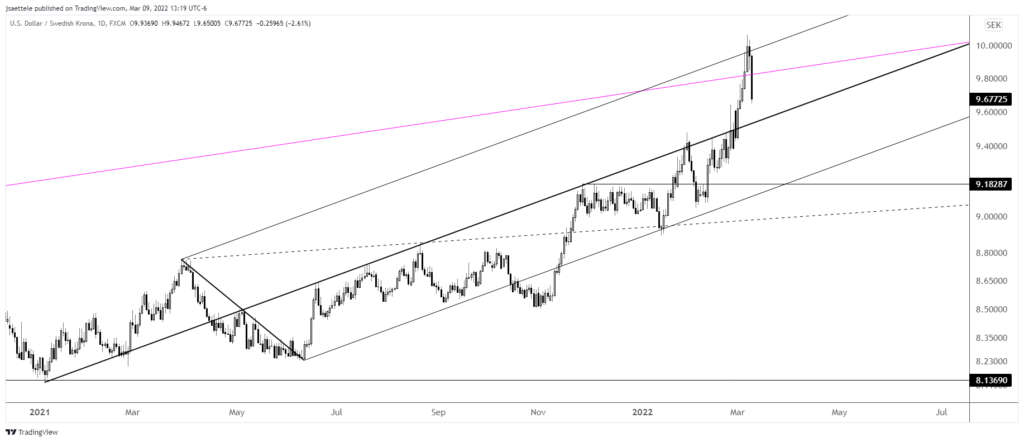
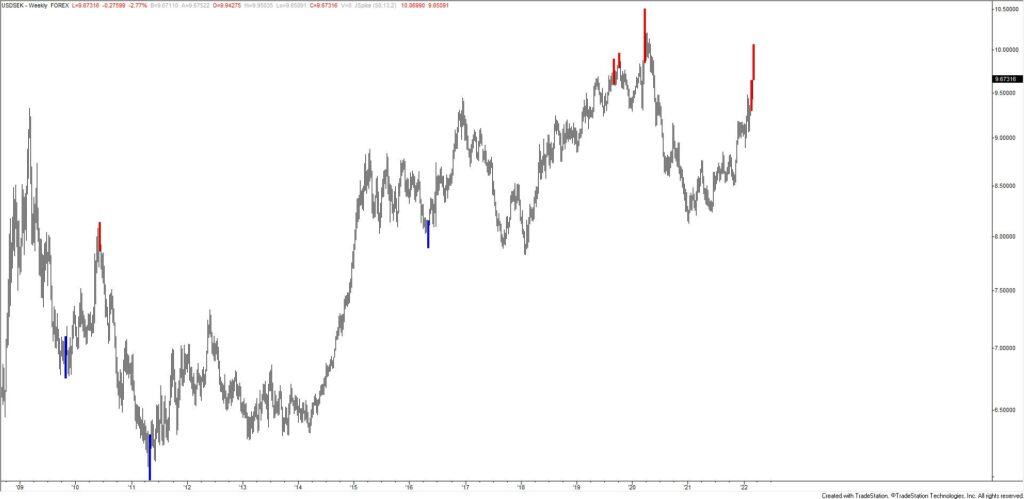
Aside from the late October/early November action outside of the pitchfork from the 2021 low, USDSEK has traded within this structure perfectly. Watch the median line for a bounce near 9.5380. If price drops below the median line, then the underside of the median line becomes resistance. There is also resistance from a parallel on a VERY long term basis (see below). Finally, the same reversal signal that flashed in EURUSD is going to flash this week in USDSEK (again…assuming we close below where we opened the week…see 2 charts down).
USDSEK WEEKLY
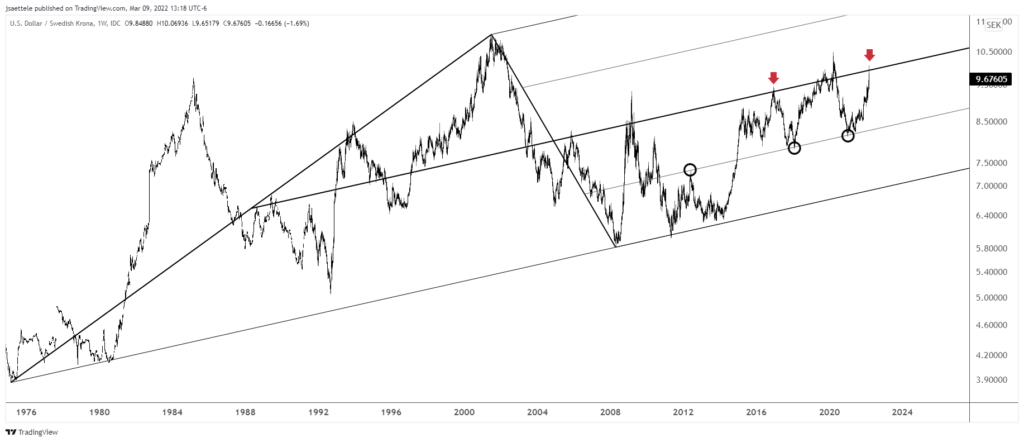
USDSEK WEEKLY
USDJPY DAILY
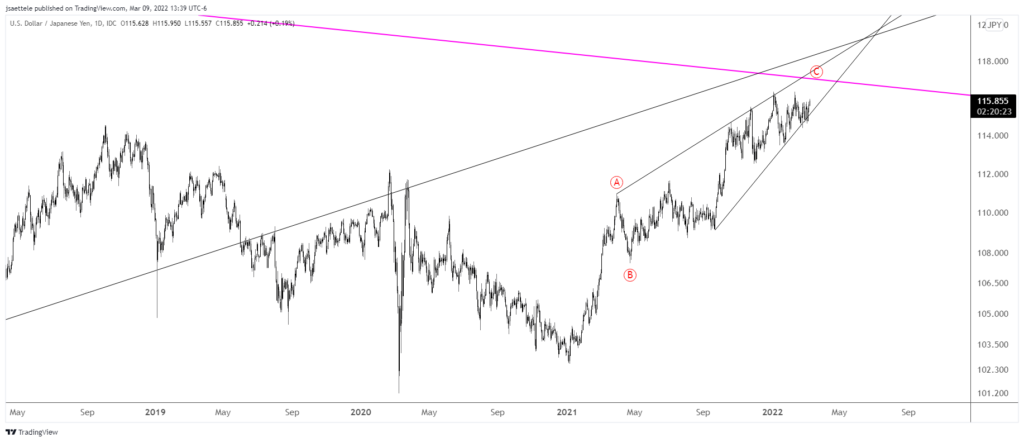
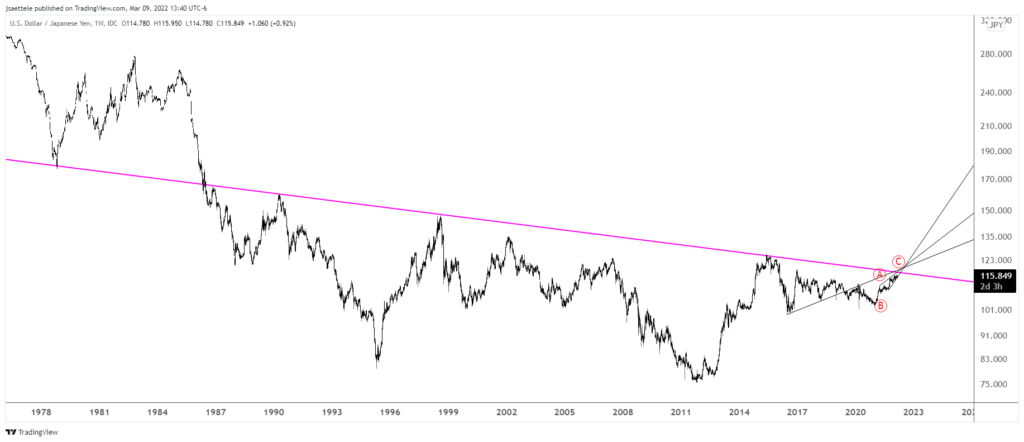
As long as the lower wedge line holds, my working assumption is that USDJPY is going to go for one more thrust higher to test the the 32 year trendline (full chart is below) near 117.25. At that point, we’ll be presented with one of the best USDJPY short opportunities ever.
3/3 – USDJPY has done nothing since November. A 32 year trendline is slightly above the market…at about 117.25. I have no idea if we get there but pay attention to the daily chart below. Action over the last year constitutes a rising wedge (see daily chart below). The lower barrier is about 114.90 (basically this week’s low). If that breaks then the short side is viable. Until then, it’s a waiting game.
USDJPY WEEKLY
EURJPY DAILY
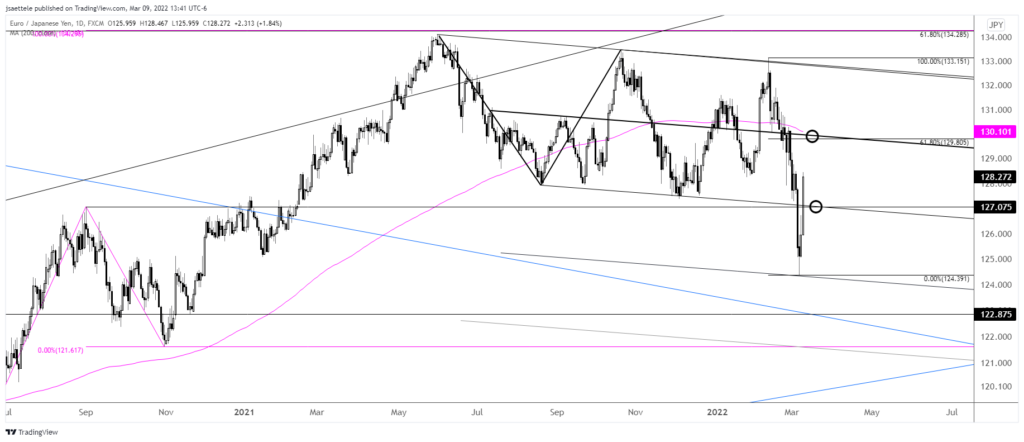
EURJPY sports a false breakdown aka bear trap. Support should be near 127.10 and 129.80-130.00 is well-defined for resistance from the 61.8% retrace and 200 day average.

