Market Update – August 3
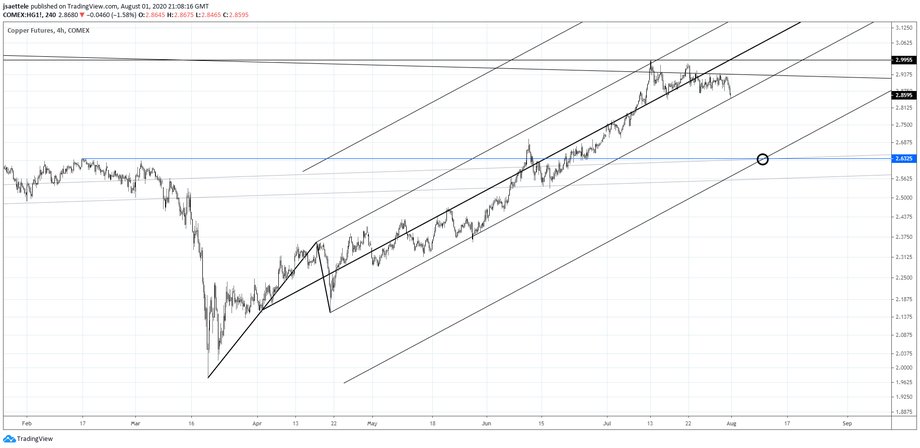
COPPER FUTURES 4 HOUR
Copper begins the week at the lower parallel from the Schiff fork off of the March low…an important spot. If it breaks, then downside focus is 2.6325. Recall that copper put in a high 3 weeks ago at a major level (see weekly chart below).
7/22 – Copper made another bearish outside day today (there was one on 7/15 too). Price continues to hold the center line but if it breaks then expect downside acceleration until the lower parallel, which is now about 2.78.
COPPER FUTURES WEEKLY

USDOLLAR DAILY

Low on Friday was 11953…right on the median line, which is a great spot for a swing low. Bullish USD here with tight risk makes sense and I can envision a ‘surprise’ rally back to 12350 or so over the next 6 weeks. Near term, pay attention to the channel from the March high. The median line is about 12080.
7/30 – USDOLLAR daily RSI is 16.53. It’s only been that low twice (date since 2011); at the April 2011 low and the January 2018 low. Levels wise, the median line of the fork from the 2017 high is about 11950 (see close up below), which is in line with the lower parallel of the Schiff fork from the March high. It’s a logical place for a reversal.
USDOLLAR 4 HOUR

EURO FUTURES DAILY

Euro futures put in a rare volume reversal on Friday (note the red bars on this chart). The volume reversal along with VWAP from the 2018 high, long term channel resistance (see 2 charts down), and a perfect Elliott channel (see 1 chart down) presents a compelling bearish setup. I’m looking towards 1.1500. Resistance should be the high volume level at 1.1825.
7/28 – Euro has reached VWAP from its 2018 high. I was thinking slightly higher (1.1823/52) before taking a stand against EURUSD but if price starts to roll over now then it may not be worth waiting given that the long term VWAP level has already been hit. Nothing to do just yet.
EURUSD DAILY

EURUSD WEEKLY

USDJPY 4 HOUR

7/27 – USDJPY continues to respect levels within the channel from the March high. Today’s low is in on the 75 line. A bounce back into the center line would present a short opportunity near 106.16. The next downside level is the lower parallel near where the decline from March would consist of 2 equal legs at 104.12.
JAPANESE YEN FUTURES DAILY

JAPANESE YEN FUTURES DAILY

The USDJPY drop from the March high consists almost exactly of 2 equal legs. Friday’s reversal occurred on 2x the 20 day average of volume. The last time that Yen reversed from at least a 50 day high on 2x volume was in October 2011. That ended up being a major Yen high (USDJPY low). I’m bullish against Friday’s low. Neat term levels to pay attention to are 106.15 and 105.30.
AUDUSD DAILY

AUDUSD reversed on Friday from long term channel resistance. Near term levels to pay attention to are .7173 for resistance (Friday’s high volume level) and .7120 and .6985-7020 for supports. A daily volume reversal also triggered on Friday (see 2 charts down). I’m bearish here.
7/28 – VWAP from the 2018 high in AUD futures have also been hit! The long term channel resistance is slightly higher…about .7215 (see below). Either way, we’re in the zone to consider going the other way. Weakness below .7065 (June high and Friday’s low) would be a decent sign that some sort of a ‘tradable’ high is in place. Until then, don’t forget about the channel line near .7215.
AUDUSD 4 HOUR

AUSTRALIAN DOLLAR FUTURES DAILY


