Market Update 9/21 – USD Levels into FOMC
10 Years of Scandinavian Capital Markets
September 22, 2021Market Update 9/22 – USDJPY is ‘Coiled’ the Most Since 2014
September 23, 2021

USDOLLAR DAILY
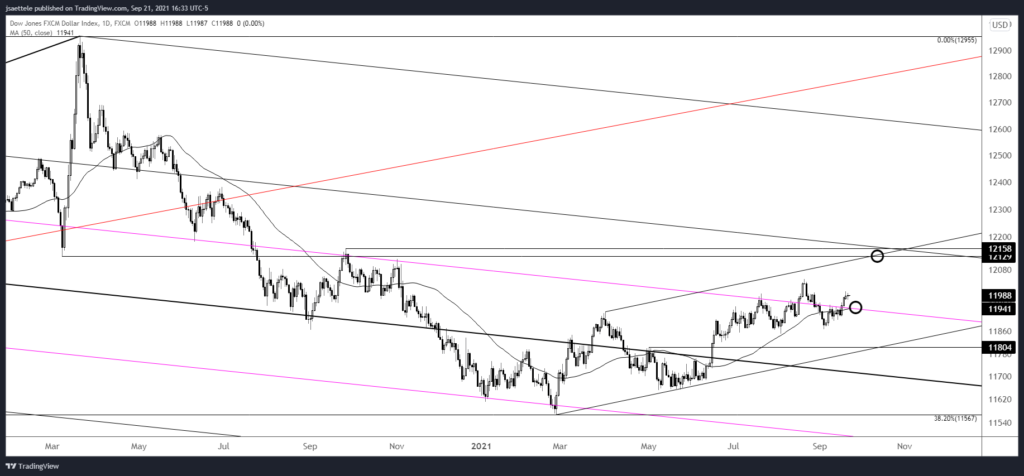
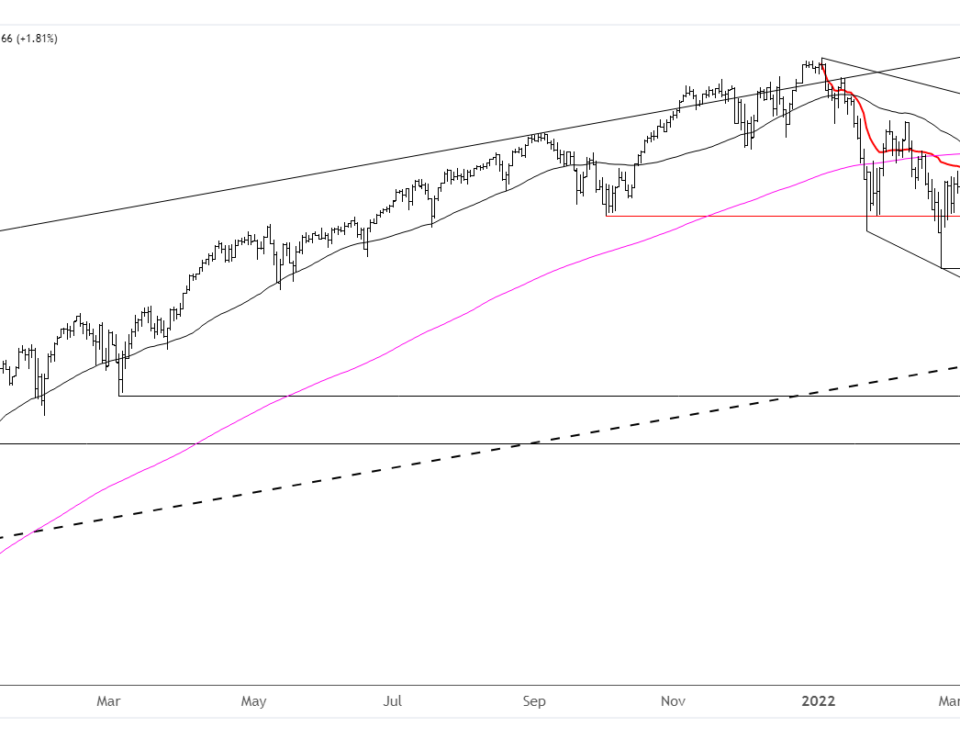
In my view, USDOLLAR has broken out and is headed to 12130/60 (the next decision point). IF price pulls back (not or later), then the parallel that has been support/resistance since June 2020 (magenta line) is proposed support along with the 50 day average at 11940. That could happen on Wednesday with FOMC, at a later date, or not at all! Bottom line, 11940 is proposed support and I’m looking towards 12130/60.9/9 – USDOLLAR has pulled back and responded to 11900 (roughly…61.8% retrace of the rally is 11902). The rally appears impulsive so expectations are for additional strength following this pullback to ‘ideal’ support. In other words…USD bullish.
GBPUSD 4 HOUR
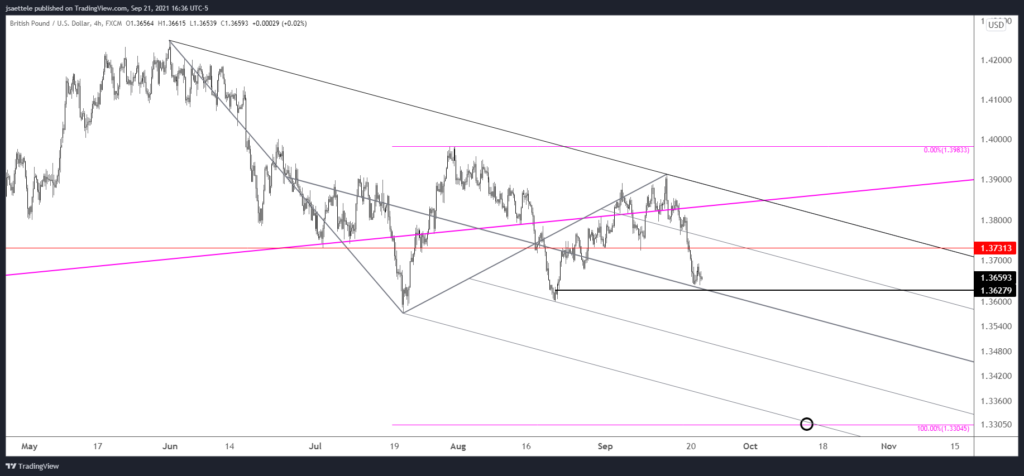
Cable is a bear but price could bounce from 1.3628, which is daily reversal support and the center line of the channel from the June high. If price does bounce, then proposed resistance is 1.3730/50. If price breaks below the center line, then the underside of the center line becomes proposed resistance in order to add to the short position. The next downside level of interest is the September 2020 high at 1.3483…then the measured level noted yesterday at 1.3305.9/20 – GBPUSD is fast approaching range lows. A break of the lows would open up where the decline from June would consist of 2 equal legs at 1.3305. This is close to VWAP from the March 2020 low (see below). The larger double top target is 1.3100. Former support at 1.3720s is now proposed resistance.
NZDUSD DAILY
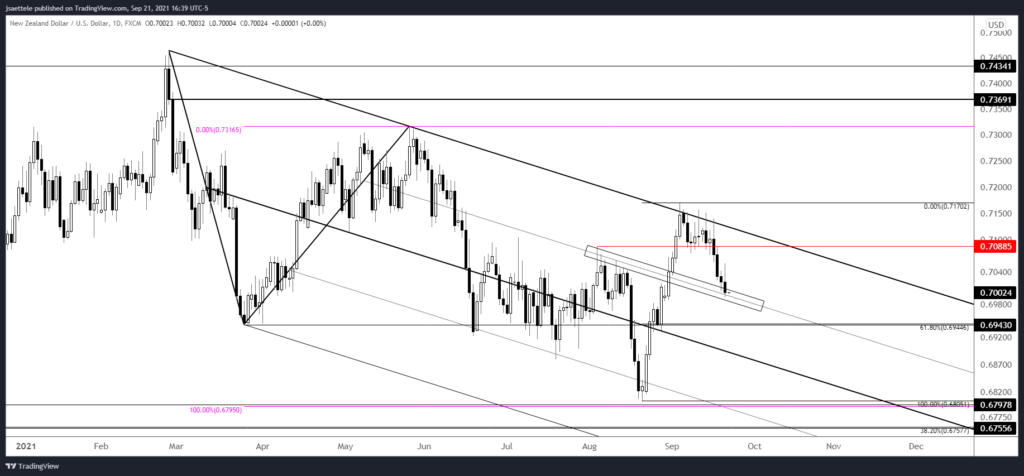
Kiwi dropped into the noted level. Support/resistance polarity concepts apply to parallels, just as they apply to horizontal levels. In this case, a parallel was previously resistance and may provide support now. If it does, then look for nothing more than a bounce into .7080/90.7/14 – NZDUSD is finally trying to separate from resistance (upper parallel of the 2021 channel). Downside focus, at least in the near term, remains .7020/30. The 50 day average is creeping up on this level now as well.
USDCAD 4 HOUR
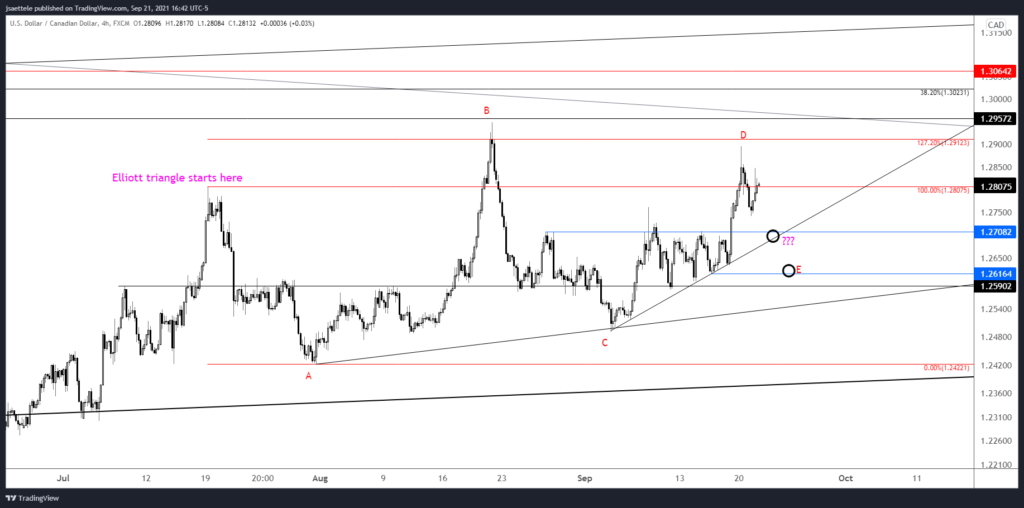
1.2760 was a decent scalp level for USDCAD today but continue to respect the triangle scenario in which price pulls back to 1.2600 or so (ideal level is actually 1.2616) before price turns back up for a breakout attempt. In the event of a shallow E wave within the triangle then 1.2708 would be a candidate for support. Bottom line, I’m looking to buy either 1.2700ish or 1.2600ish. Hopefully, FOMC clears up the situation.9/20 – Today’s USDCAD rally may have been wave D of the triangle, as noted in last week’s analysis. If a triangle is still underway, then price will pull back to 1.2600 or so before turning up and eventually breakout out above the 8/20 high. I’ll also keep 1.2760 (former high) in line for possible support.
USDCNH 4 HOUR
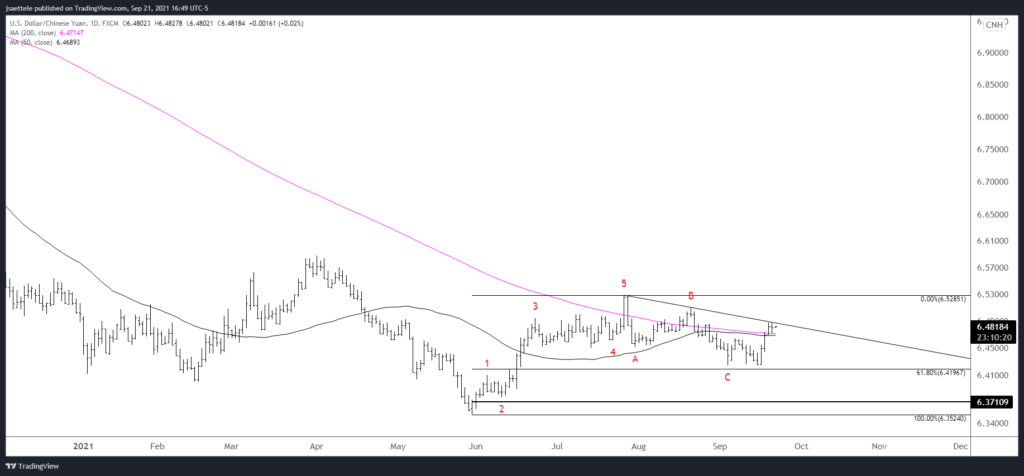
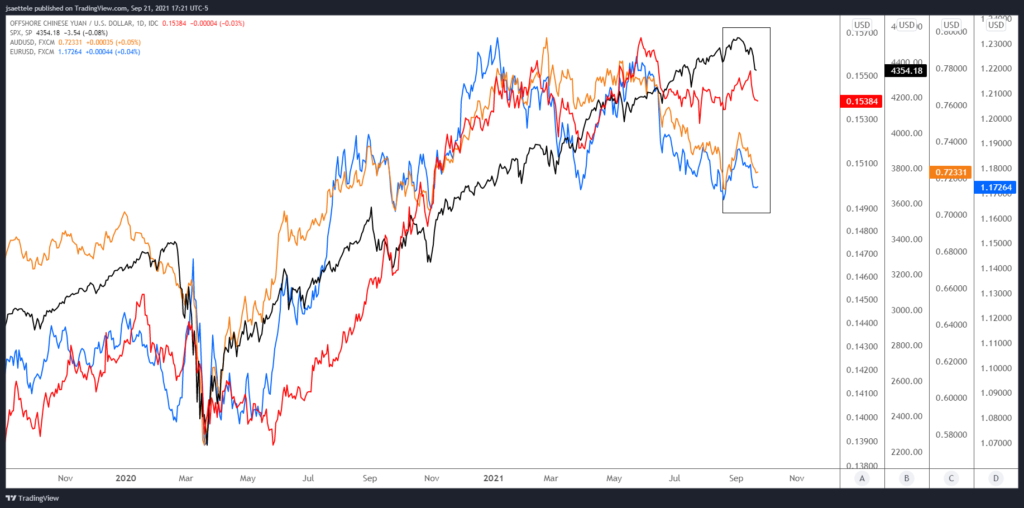
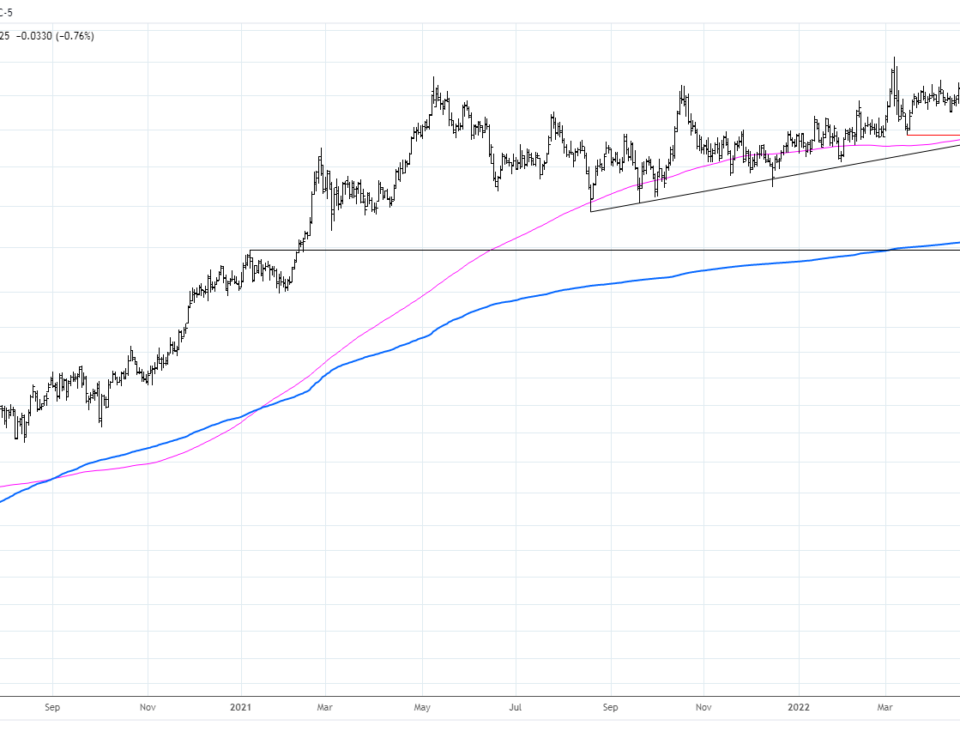
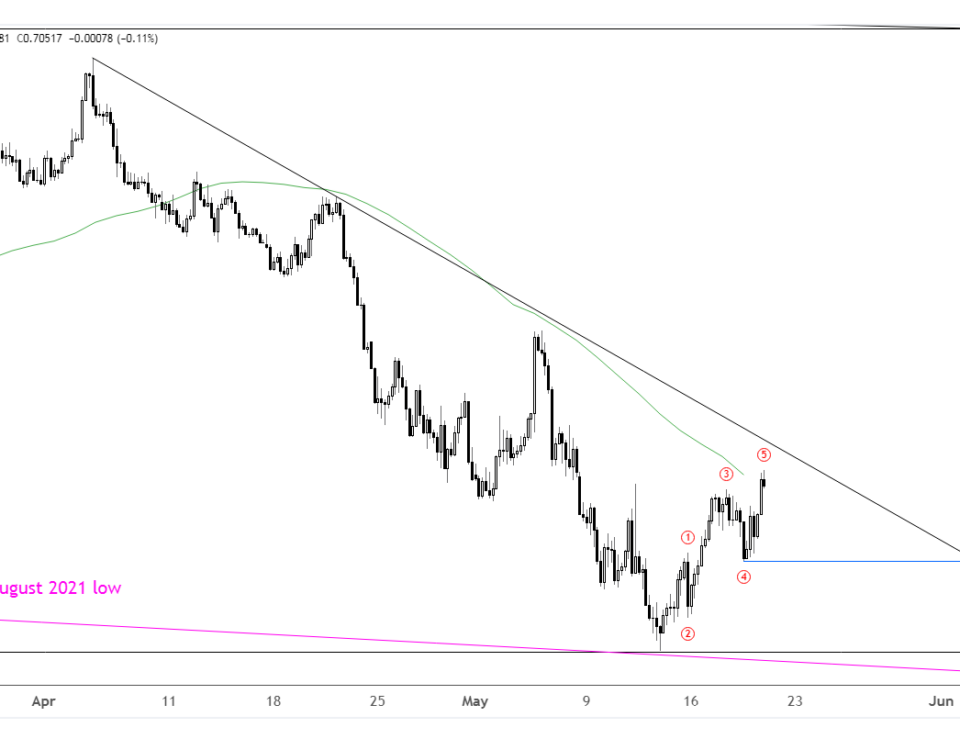
Keep an eye on USDCNH. Recall the ‘5 waves up and 3 waves down since the 5/31 low’ therefore the implication is for a 3rd or C wave advance (strong advance). Given the importance of China generally but also specifically to the current news cycle, a USDCNH breakout would likely be coincident with additional USD strength across the board (perhaps not Yen) and risk-off (see below).9/6 – USDCNH is extremely interesting because there are 5 waves up and 3 waves down since the 5/31 low. The recent low is just above the 61.8% retrace of the impulsive advance as well. The implication from the Elliott pattern is that a strong advance (either a 3rd or C wave) is underway. Also, price has responded to long term support (see below). Recall the false breakdown in May. A strong USDCNH advance could have significant implications for AUDUSD (bearish) too.
CNHUSD (RED), AUDUSD (ORANGE), AND EURUSD (BLUE), AND SPX (BLACK)
