Market Update – May 27
USDOLLAR DAILY
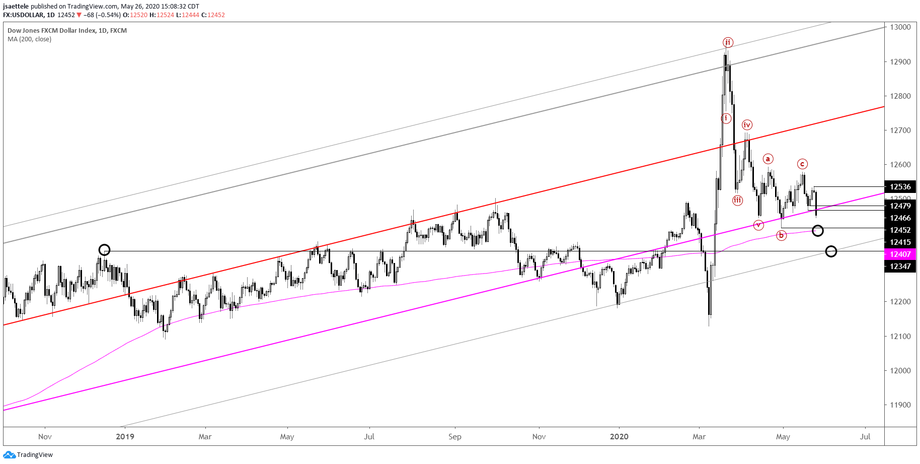
USDOLLAR found resistance at the cited level (recovery high was 12536) and broke down today. Individual USD crosses nailed their supports as well (see levels noted below from last week). My wave count interpretation is that weakness from the 5/18 high is either a 3rd or C wave so downside potential is significant in the coming weeks and months. Near term levels to pay attention to are 12415 and 12347 for supports and 12466/79 for resistance.
5/21 – The USDOLLAR is stuck between a rock and a hard place. Price is bouncing from major support (see long term chart inyesterday’s post) but downside potential is significant from an Elliott perspective. In other words, a bearish break is ‘favored’ soon. Until that happens, trading on either side of the USD (unless extremely short term) is not a high confidence wager. I am still thinking that this bounce finds resistance near the underside of the line off of the Aprl and May lows. That’s now about 12530. As for specific zones/levels in USD crosses, my focus for USD resistance is
EURUSD 1.0870-1.0910
GBPUSD 1.2160
AUDUSD .6500/20
NZDUSD .6050/70
USDCAD 1.4010
EURUSD DAILY

EURUSD faces a test from range highs and the 200 day average at 1.1012 but I’m a bull as long as price is within the bullish channel from the March low. Proposed support is the 25 line (blue parallel) near 1.0935. The median line is possible resistance near 1.1065 but general upside focus is the upper parallel near 1.1320.
GBPUSD 4 HOUR

GBPUSD low last week was 1.2161 and my view is that a 3rd wave in underway towards much higher levels. Initial focus, and only for a pause, is the center line near 1.2770. Support should be 1.2250-1.2300 now. The top of this zone is a high volume level from today along with VWAP from the 4/30 high, which was previously resistance (see futures chart below).
5/19 – Resistance came in slightly higher than thought for GBPUSD but the idea remains the same. Proposed support for long entry is 1.2160/90s. The bottom of the zone is the 61.8% retrace of this week’s rally and 4/6 low. The top of the zone is VWAP from this week’s low (see hourly futures chart 2 charts down). Additional bullish evidence includes a daily volume reversal yesterday (see daily futures chart below). The last daily volume reversal was in January 2017, which was an important low. Also, don’t forget seasonal tendencies are now bullish. Elliott structure suggests that the rally from this week’s low is either a C wave or 3rd wave, so upside potential is significant.
BRITISH POUND FUTURES HOURLY

AUDUSD DAILY

The current level in AUDUSD is significant so a ‘surprise’ failure isn’t out of the question. Given my USDOLLAR bearish view though, I lean towards the idea that AUDUSD is headed towards the next big level at .6823 (gap). .6600 is proposed support (see chart term channel below).
5/21 – AUDUSD made an inside day today and is sitting right on the April and early May highs. A high volume hour triggered today at .6568. Use that as a reference point. If price breaks below the short term trendline (dashed line on this chart), then I’ll favor the short side until .6500 (200 hour average and 25 line of a short term channel…notice how the the 25 and 75 lines have been ‘in play’). This is very short term.
AUDUSD HOURLY

NEW ZEALAND DOLLAR FUTURES DAILY

NZDUSD is also into a massive level. High today was right at VWAP from the December high and 2020 VWAP. Similar to AUDUSD, I am ‘thinking’ that this breakout is for real and that NZDUSD is headed towards .6448 (3/9 high and upper parallel of channel from the March low). Watch for support .6156.
5/20 – A 3rd or C wave higher is underway in NZDUSD so upside potential is significant. Similar to AUDUSD, I ‘want’ to buy weakness. The best to do so looks like .6070 or so. This level is supported by former resistance, parallel consideration (25 line of a new channel and top side of former trendline resistance), and VWAP (see below). Seasonal tendencies are now bullish.
USDCAD 4 HOUR

USDCAD has broken down and near term focus is on 1.3607. This is the 61.8% retrace of the rally from the December low, trendline, and lower parallel from a bearish channel. Resistance should be the underside of the channel center line and recent lows at 1.3850.
5/19 – A sharp downside break from the 1 month+ triangle would target 1.3550-1.3600. If we’re going to get a break sooner rather than later then 1.3970-1.4010 should provide resistance. Analysis of CAD futures (see below) reinforces a bullish CAD (bearish USDCAD) view and the proposed target. VWAP from the March CAD low held as support at the most recent low (USDCAD high) and 2020 VWAP is the equivalent of 1.3600 in USDCAD!
GBPJPY 4 HOUR

GBPJPY broke out from a head and shoulders bottom today. There is resistance up to 133.18 (5/11 high) so respect potential for a minor pullback. Support should be near 132 (top side of the neckline and lows in late April). As is the case with GBPUSD, upside potential is significant. A move to 140.80 would be nothing more than a rally to the top of the channel and 2 equal legs up from the March low.


