
Market Update 3/24 – A Look at Select Yen Crosses
USDJPY DAILY
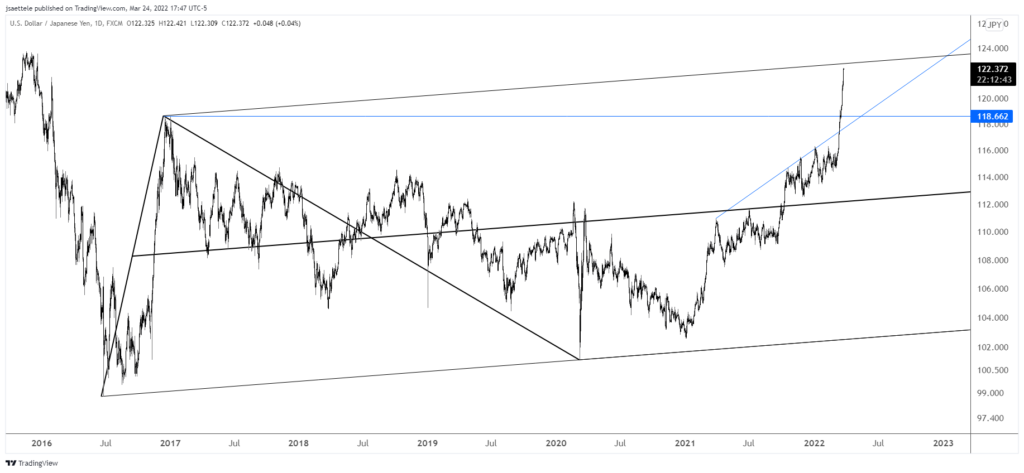
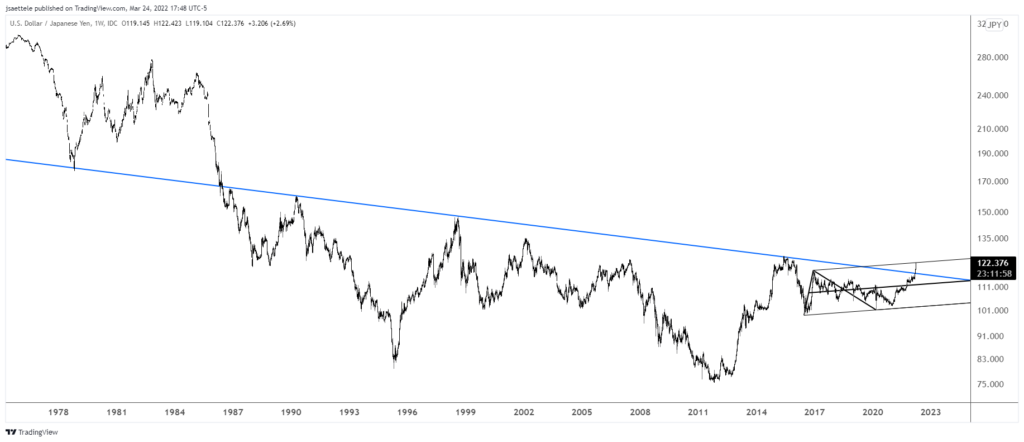
Yen crosses are going through the roof. On a very long term basis, the evidence suggests that they could go A LOT higher. For example, the weekly chart below highlights the breakout above the trendline that originates at the 1990 high! That’s significant. In the near term however, my ‘guess’ is that a pullback is around the corner. USDJPY is closing in on the noted channel from the 2016 low. That’s about 122.70. Major support is anywhere between 117.00 and 118.60s.
3/23 – USDJPY has reached an interesting level. The spot in question is defined by 2 equal legs from the 2016 low at 121.30. Also, possible channel resistance is slightly higher…near 122.50. Notice how the center line of this channel was resistance in June 2021, just before median line acceleration occurred in October. Finally, prediction articles are popping up. Remember, a trend is almost always near the end or about to realize a counter reaction once linear extrapolations begin to appear. To be sure, there is no setup to fade at this point but beware of the zone from now to 122.50.
Do you make a profit trading USD/JPY?
Try our funded trader program and get up to $1,000,000 in funding.
Learn more
USDJPY WEEKLY
EURJPY WEEKLY
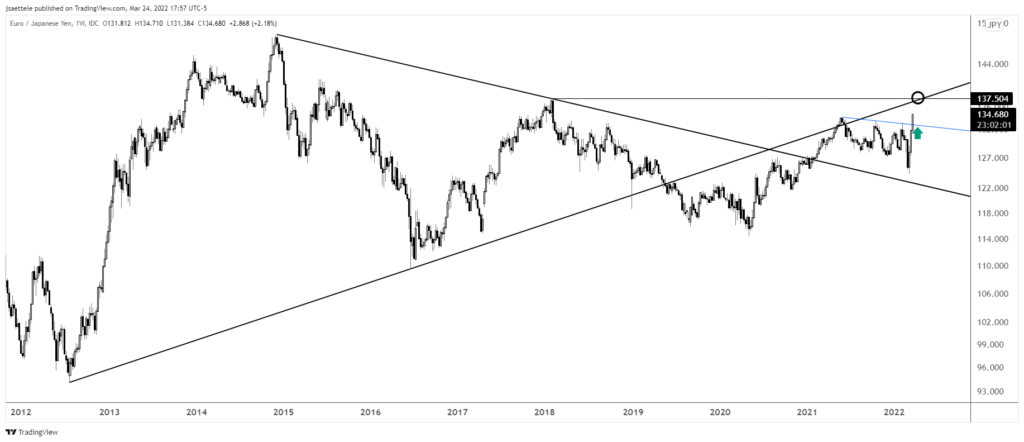
The 2018 high in EURJPY at 137.50 is probably in store. The level is also defined by the trendline from the 2012 low. Near term, watch for support is price pulls back to the breakout line (blue line) near 132.75.
GBPJPY WEEKLY
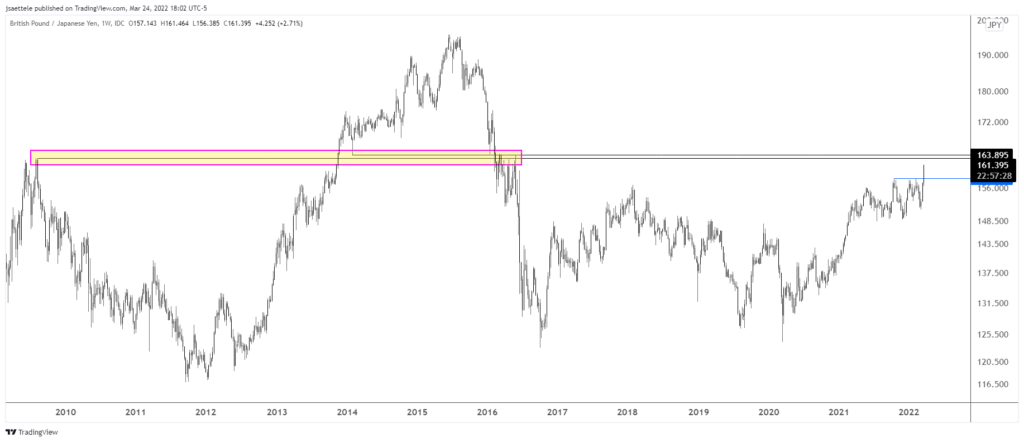
164.00is is a level to pay attention to in GBPJPY for a possible pause. This is the 2009 high, support in February 2014, and resistance in 2016. When/if price pulls back, I’d think that former resistance at 158.20s is now support.
NZDJPY WEEKLY (LINEAR SCALE)
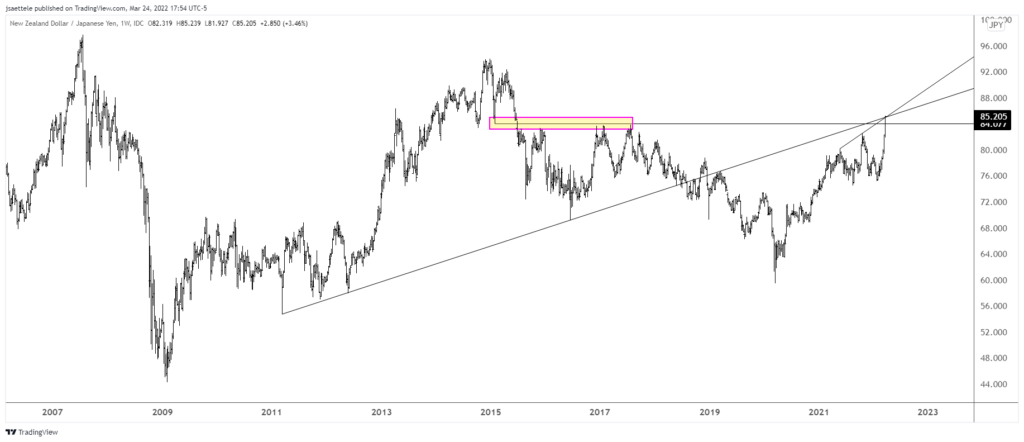
NZDJPY has reached the underside of the trendline that originates at the 2011 low. This line was support in 2016 and 2018 before providing resistance in 2019. If price turns lower here and gets back below the well-defined 84 level, then there will be an opportunity to try the short side. I’ll also note that today’s daily RSI reading was 88.93. According to my data, that’s the highest daily RSI reading ever. The only close reading occurred 12/05/2005 at 88.32. The cross dropped 900 pips over the next 3 weeks.


