Market Update 3/23 – BTCUSD Triangle Since January Low
BTCUSD DAILY
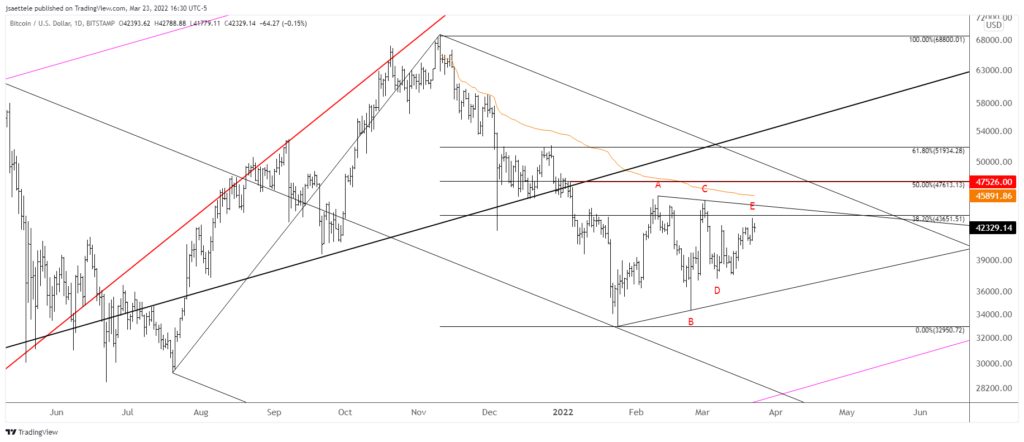
Everything since the January low in BTCUSD appears to be a triangle. Triangles typically break in the direction of the prior move…in this case that would be lower. Under Elliott, triangles consist of 5 waves labeled A-B-C-D-E. BTCUSD clearly sports 5 waves since the January low. The implication is that price rolls over soon and eventually breaks beneath the January low.
Do you make a profit trading BTC/USD?
Try our funded trader program and get up to $1,000,000 in funding.
Learn more
GBPUSD 4 HOUR
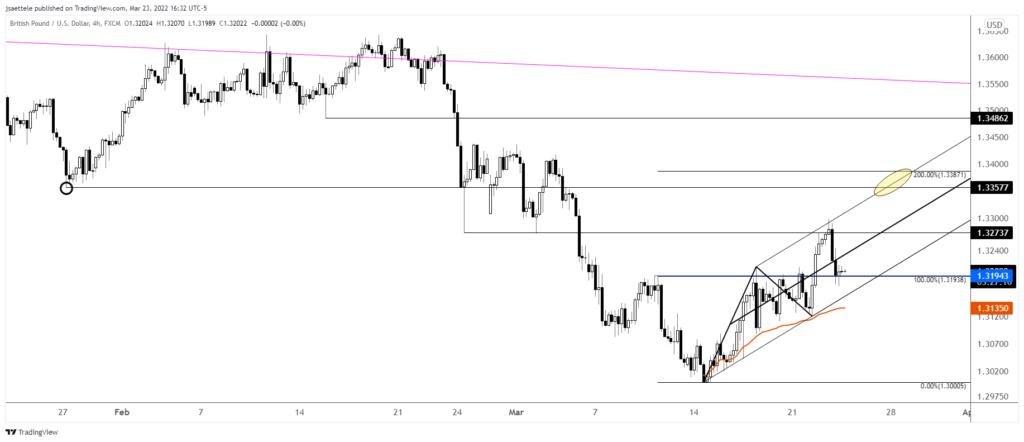
GBPUSD has pulled back to the proposed support zone. Ideally, today’s low remains intact as the drop resulted in a test of former resistance. In fact, this is nothing more than a re-test of a head and shoulders neckline. The objective from the head and shoulders pattern is 1.3387…just aboe the noted 1.3360. If price does slip slightly lower, then keep 1.3160s (channel) in mind for possible support. It’s a positive that VWAP from the low has provided support on each touch.
3/22 – GBPUSD has already followed through on last week’s reversal. This is somewhat frustrating because we didn’t get a chance to buy proposed 1.3080/90 support. In any case, support now should be 1.3194-1.3210. The big test on the upside (near term at least) is 1.3360. This is the January low and 200 period average on the 4 hour chart.
USDJPY WEEKLY
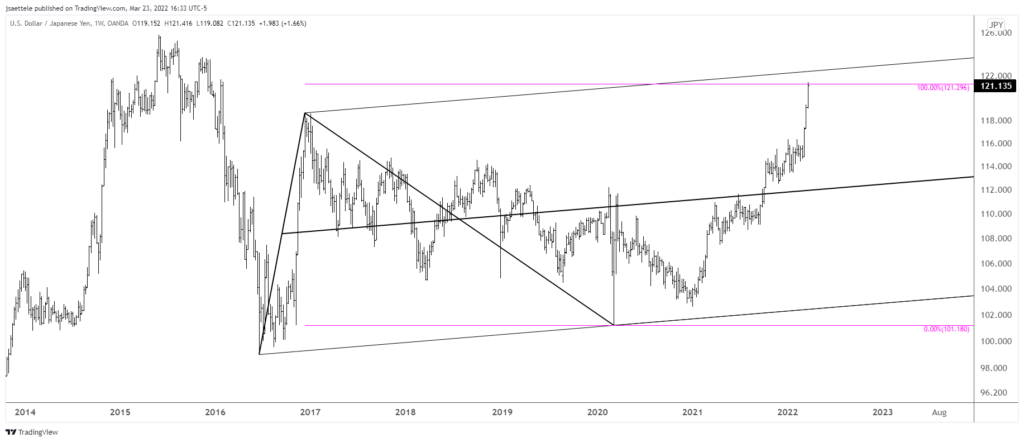
USDJPY has reached an interesting level. The spot in question is defined by 2 equal legs from the 2016 low at 121.30. Also, possible channel resistance is slightly higher…near 122.50. Notice how the center line of this channel was resistance in June 2021, just before median line acceleration occurred in October. Finally, prediction articles are popping up. Remember, a trend is almost always near the end or about to realize a counter reaction once linear extrapolations begin to appear. To be sure, there is no setup to fade at this point but beware of the zone from now to 122.50.
AUDJPY DAILY
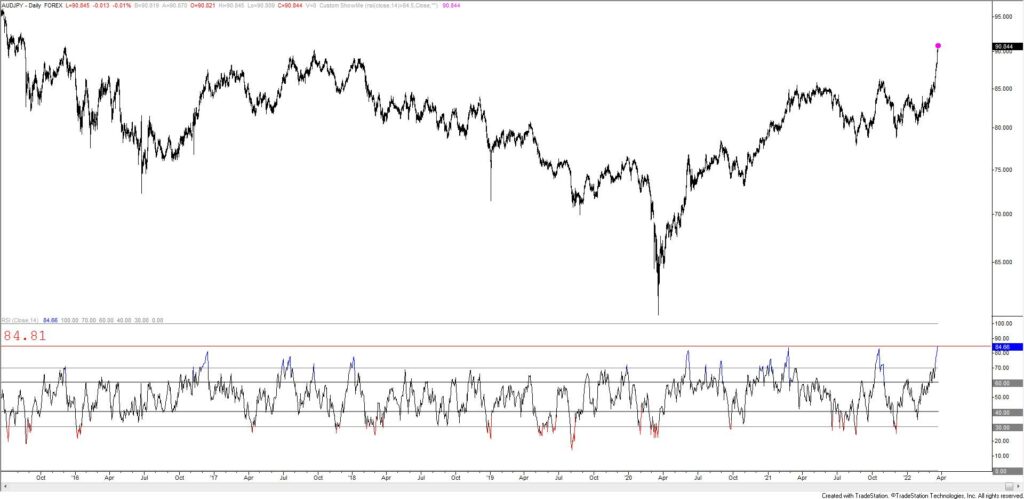
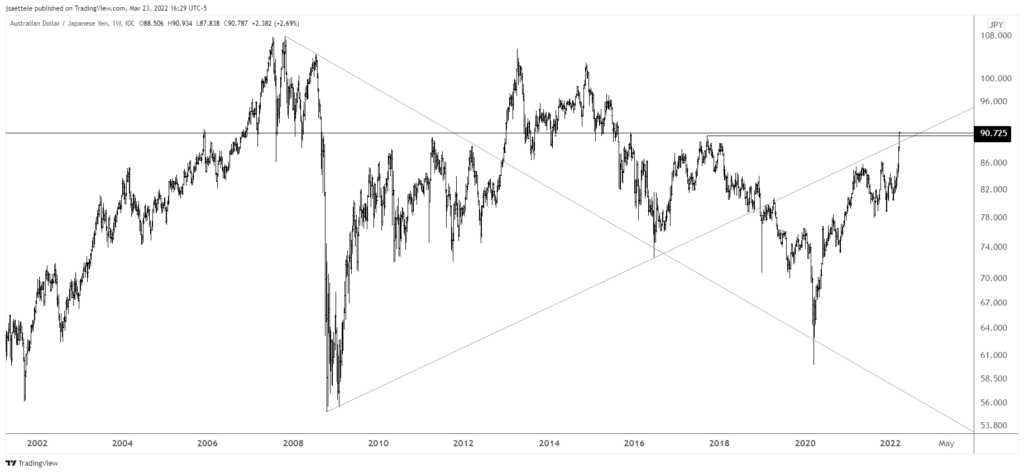
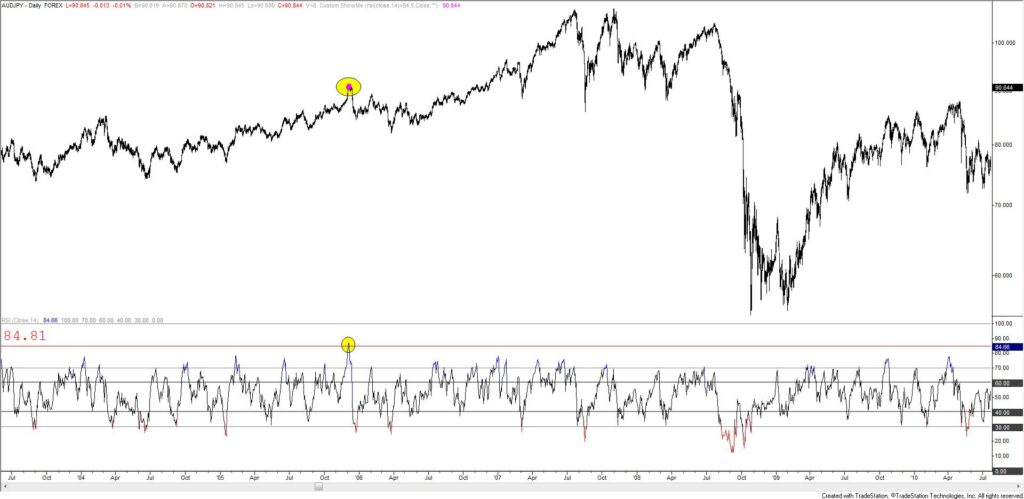
AUDJPY broke out alright and has already exceeded my target. This is a well-defined horizontal level (see 2 charts down) and daily RSI finished at 84.81 today. The only time that daily RSI was higher (since 1999) was in December 2005 (see below). This is just an observation at this point…there is no setup to fade this just yet.
3/10 – AUDJPY action since last May is an ascending triangle. The pattern portends a bullish outcome. What’s more, the cross is historically a decent barometer of risk appetite. Well, equities have been slammed for months yet AUDJPY is pressing the highs. This alone is reason to suspect an imminent breakout. A breakout occurs above 86 and would target the September 2017 high at 90.30 initially.
AUDJPY DAILY (2005)
AUDJPY WEEKLY
