Market Update 3/28 – Crypto Nearing Important Levels
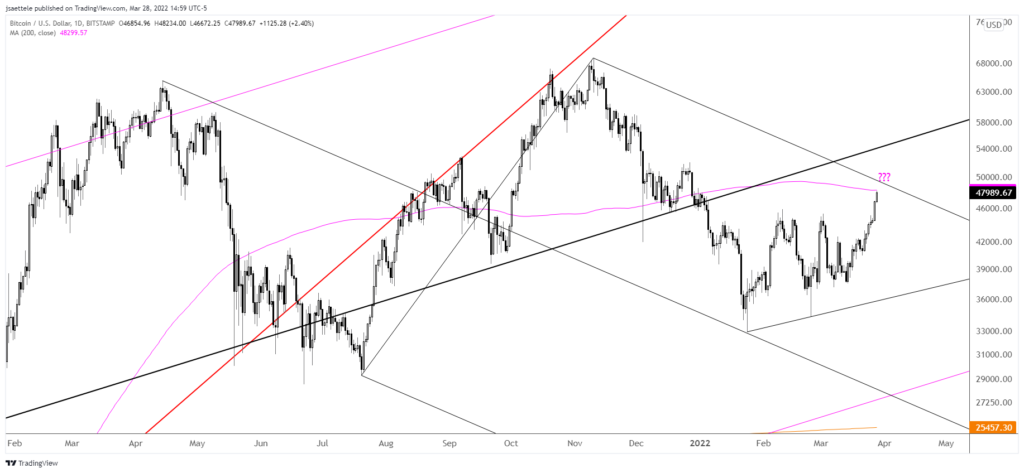
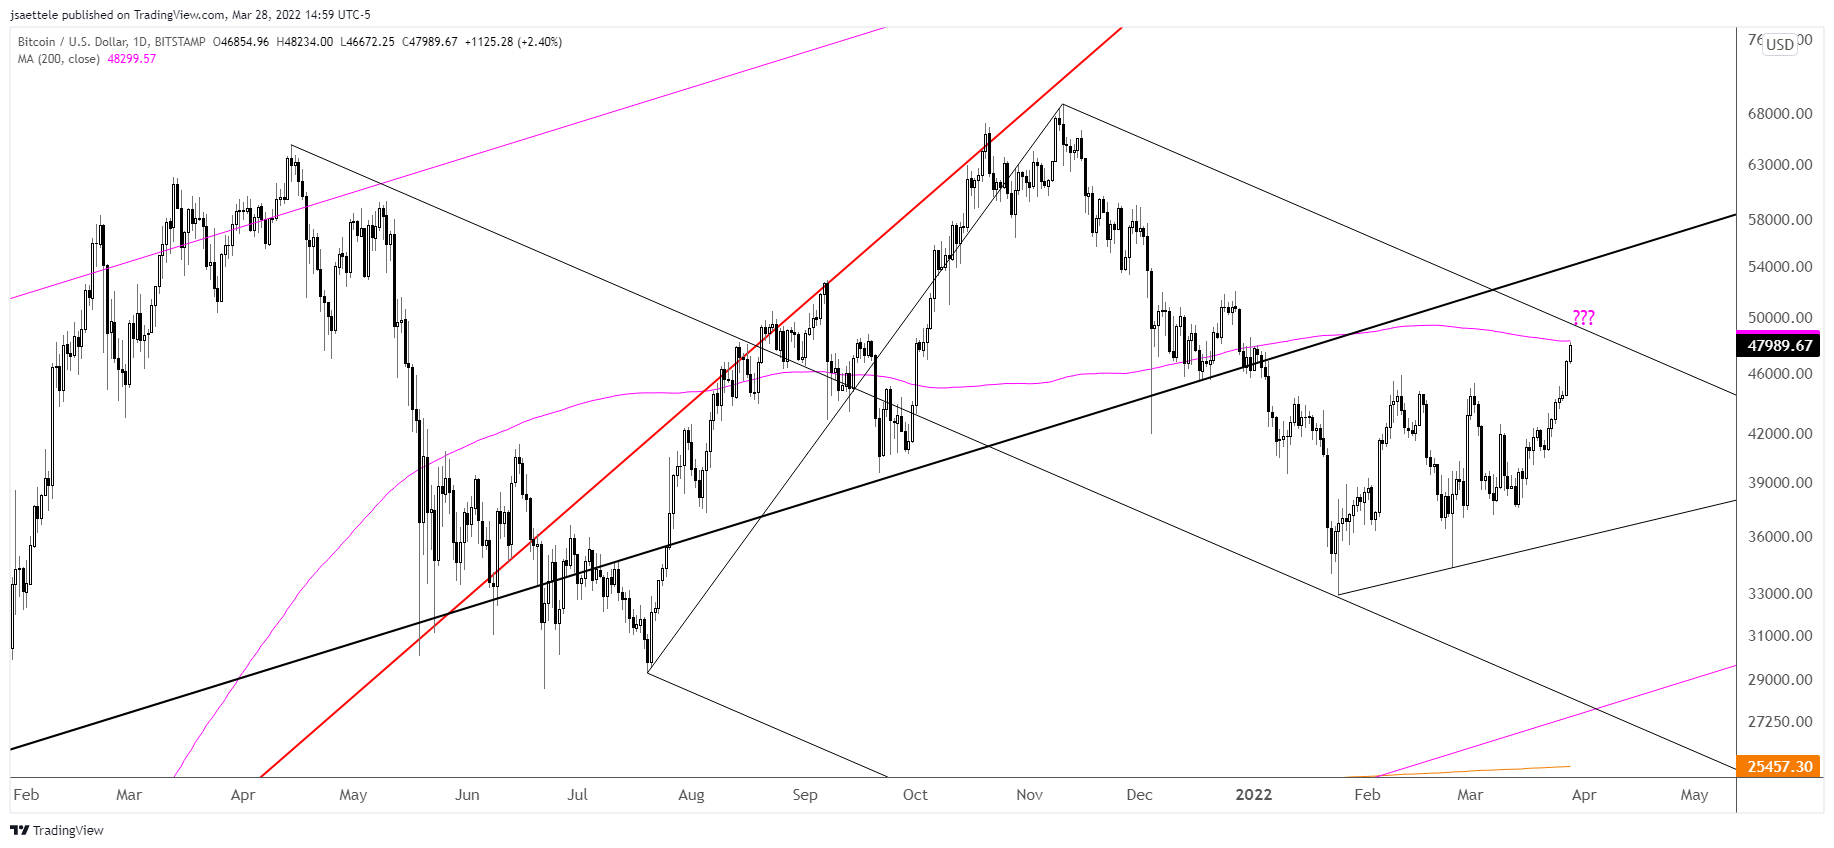
BTCUSD DAILY

The triangle scenario described last week is no longer valid in BTCUSD. However, note that price has reached the 200 day average and the upper parallel from the median line of the fork that originates at the April 2021 high is slightly higher…near 49500. Pay close attention to that level for resistance if reached because since the January low registered right at the median line.
ETHUSD DAILY

ETHUSD is closing in on the 200 day average and the line that connects the May and September highs. This line was support prior to the big decline early this year. I’m on alert for resistance.
Do you make a profit trading ETH/USD?
Try our funded trader program and get up to $1,000,000 in funding.
Learn more
USDSEK DAILY

USDSEK is closing in on proposed resistance from the noted median line (red line). Again, this line originates at the 2021 high. It’s about 9.6100 now. Remember, USDSEK tends to be a ‘tell’ for general USD direction (especially against European FX) so I’ll be keeping an eye on EURUSD in particular when/if USDSEK reaches and reacts the the median line.
3/21 – Pay attention to USDSEK, notably the underside of the median line, which has been precise resistance for nearly a year. The median line is now about 9.5650.
AUDUSD DAILY

Aussie may finally be about to pull back and in turn provide us with the chance to get long. I’m still thinking that ideal support is the top side of the 2021 trendline (blue line), which was resistance in early March. That line is about .7390 now.
3/22 – AUDUSD broke out today so focus is on .7555. This is the October high and upper parallel of the bullish fork that we’ve been following for several months. If price overshoots then .7620 is huge. This is the 61.8% retrace and a level that’s been a key pivot for the last year. The top side of former trendline resistance (blue line) is now proposed support near .7400.
NZDUSD DAILY

Kiwi has already reached proposed support, which casts some doubt on whether Aussie will drop into proposed support. Remember, the current level for NZDUSD is defined by the top side of the line that connects the December 2019 and September 2020 highs. This line was support in 2021 until it became resistance in January. The level is important and I’m looking for a hold.
3/22 – The NZDUSD low was indeed 3/15 and price has now broken above the key neckline. This line (upward sloping blue line) has been key support and resistance since August so the move above is significant and viewed with a great deal of confidence. For this reason, I like the Kiwi setup better than the AUDUSD setup. .6890 should be support if reached. The upside level of interest is the line off of highs in 2021 (red line) near .7050.
USDCAD DAILY

USDCAD broke the trendline from the June 2021 low last week. The underside of that line was nearly reached today near 1.2605. This is also the 200 day average. I’d love a tag of that line in order to short for resumption of the ‘new’ bearish trend (as suggested by the trendline break).


