Market Update 3/29 – Yen Volume Reversal Signal
NASDAQ (NQ) FUTURES DAILY
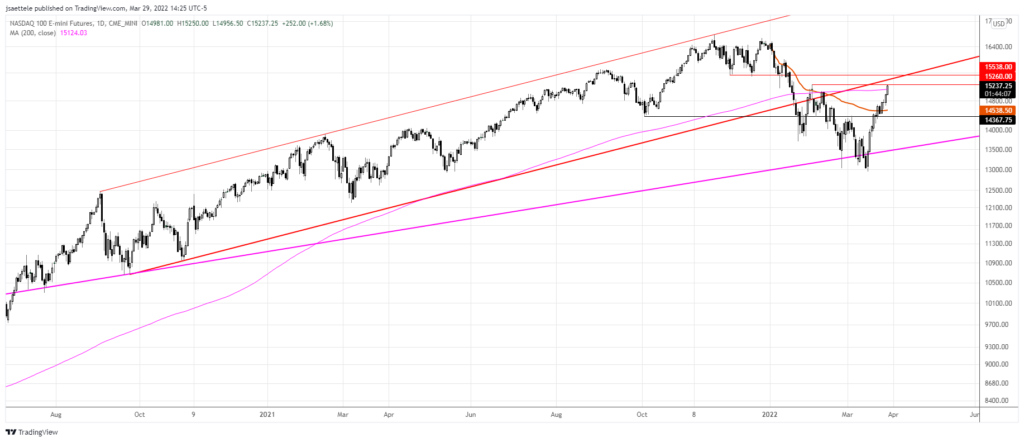
NQ has reached the zone that was noted for possible resistance 3 weeks ago. The February high has been reached and the underside of former channel support is slightly higher near 15415. The top of the zone is support from December at 15538. I’m on alert for a reversal up here.
3/9 – NQ held the top side of the line that originates at the November 2014 high. This line crosses highs in 2018 and 2020, and lows in 2020. It was also support on 2/24. I’m ‘thinking’ that price attempts a recovery back into 15000+. There’s a lot up there for resistance, including the underside of former channel support, the 200 day average, and the 61.8% retrace.
EURUSD 4 HOUR
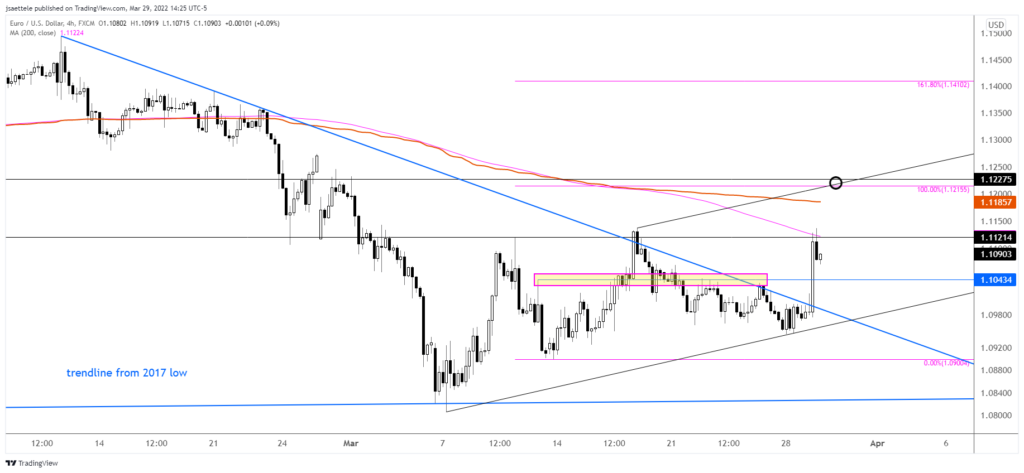
EURUSD broke above short term trendline resistance so focus is squarely on 1.1218/30. It’ll be interesting to see how we finish out the month. It’s possible that EURUSD leaves a very bullish monthly candle (long lower wick). Watch for support in the 1.1040s.
3/22 – EURUSD action since the low ‘fits’ within a Schiff fork. As such, it’s appropriate to hold a constructive view against today’s low. A breakout occurs above the trendline that originates at the 2/10 high near 1.1060. Watch for support at 1.1007. The first upside level of interest on a break above the noted trendline would be 1.1218/30 (2 legs up and month open).
Do you make a profit trading EUR/USD?
Try our funded trader program and get up to $1,000,000 in funding.
Learn more
NZDUSD DAILY
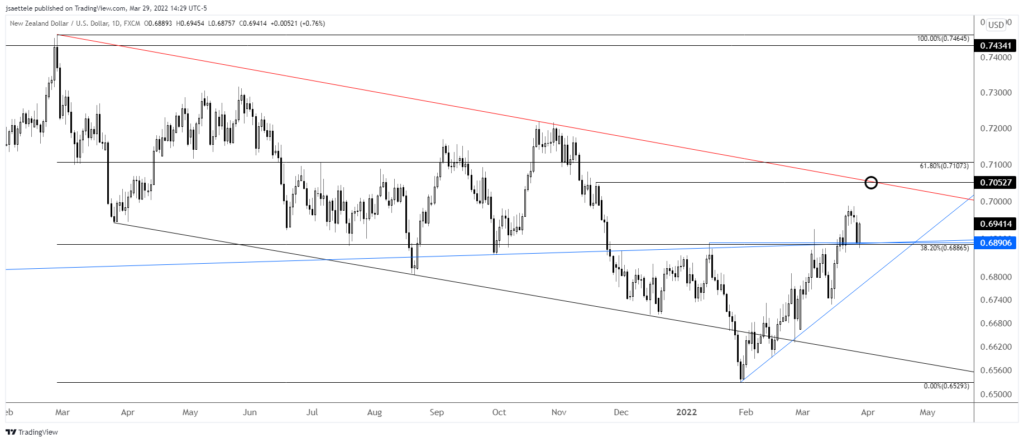
NZDUSD held beautifully so it’s ‘proper’ to trade from the long side while price is above today’s low. Near term focus is the 2021 trendline (red line), which is near .7050. Watch for .6915 support.
3/28 – Kiwi has already reached proposed support, which casts some doubt on whether Aussie will drop into proposed support. Remember, the current level for NZDUSD is defined by the top side of the line that connects the December 2019 and September 2020 highs. This line was support in 2021 until it became resistance in January. The level is important and I’m looking for a hold.
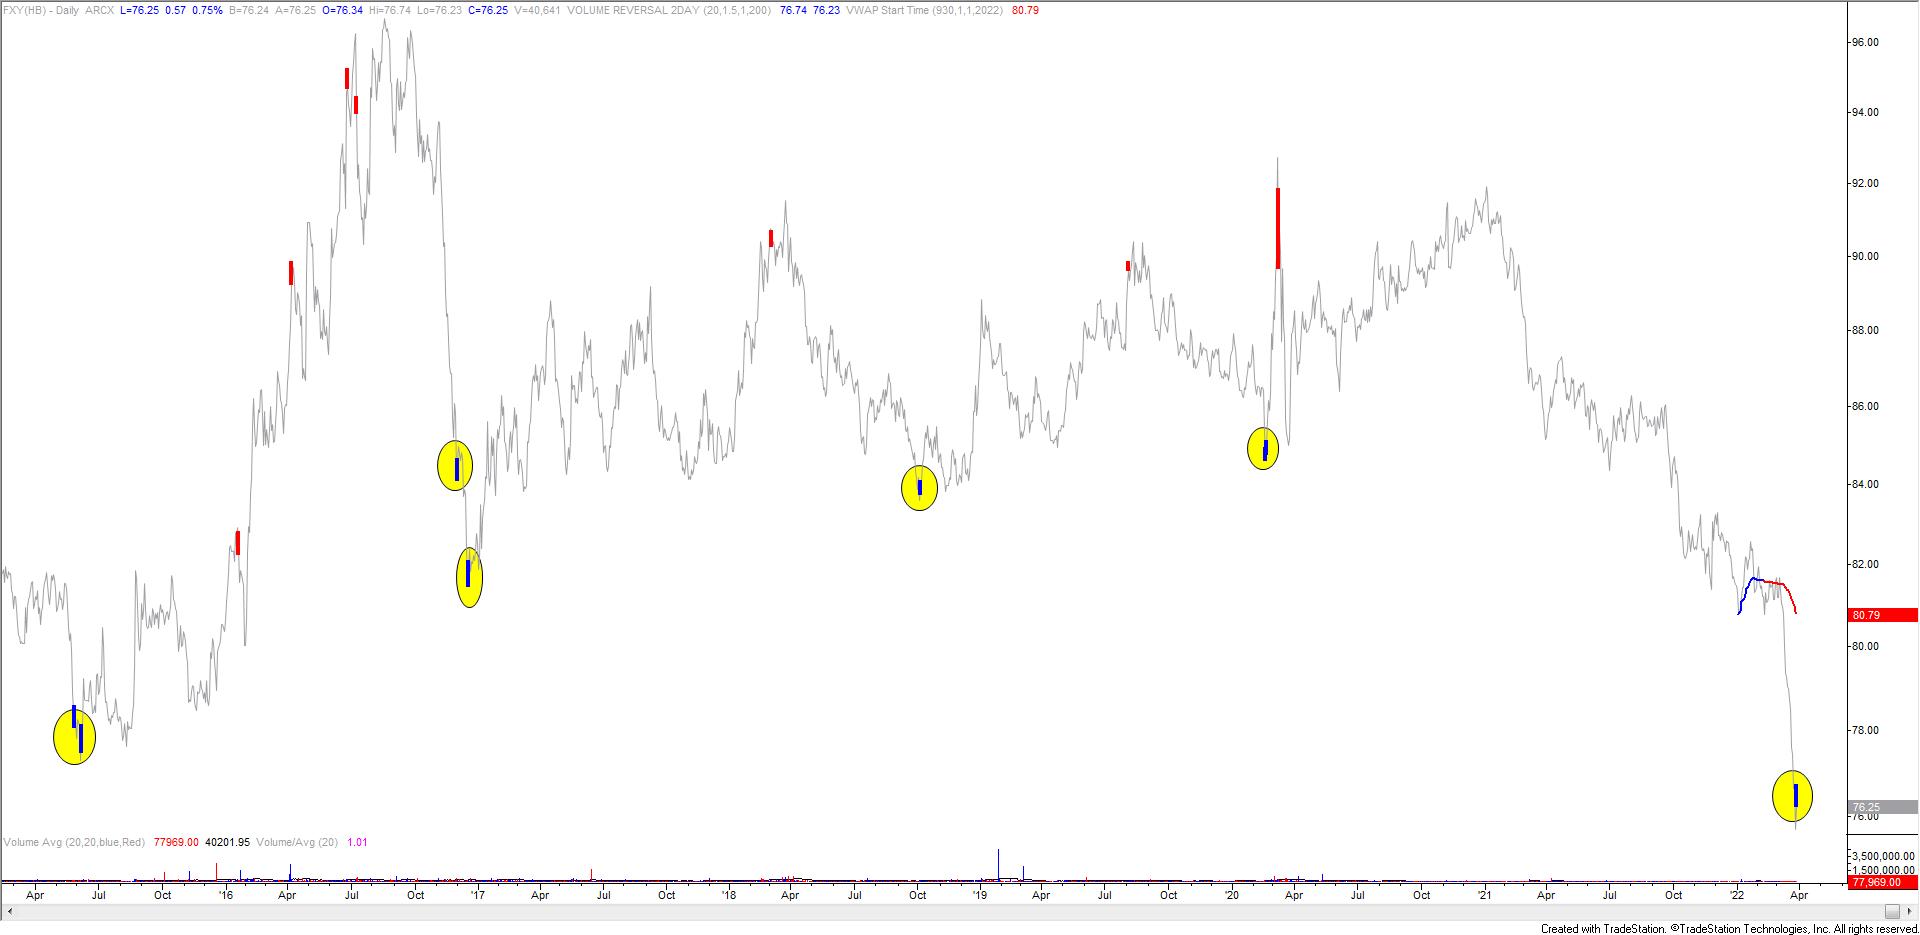
FXY (JAPANESE YEN ETF) DAILY
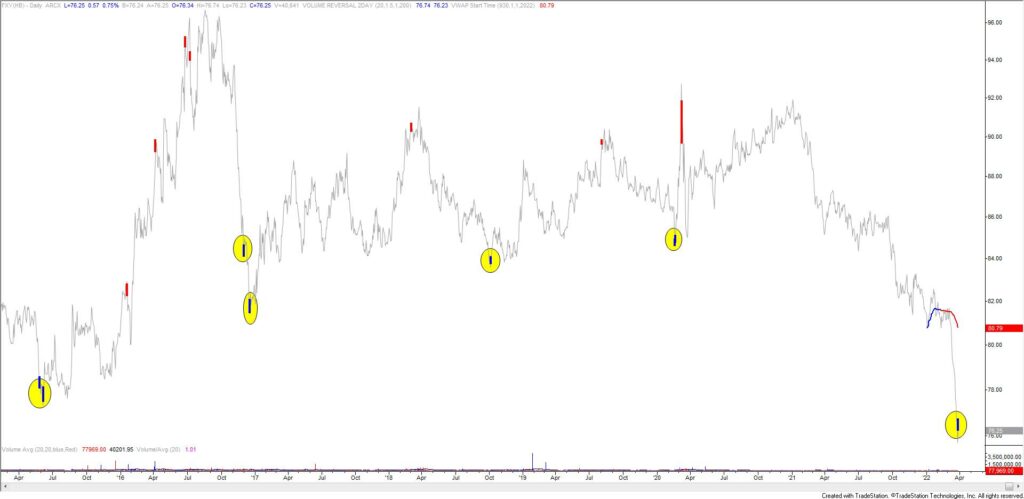
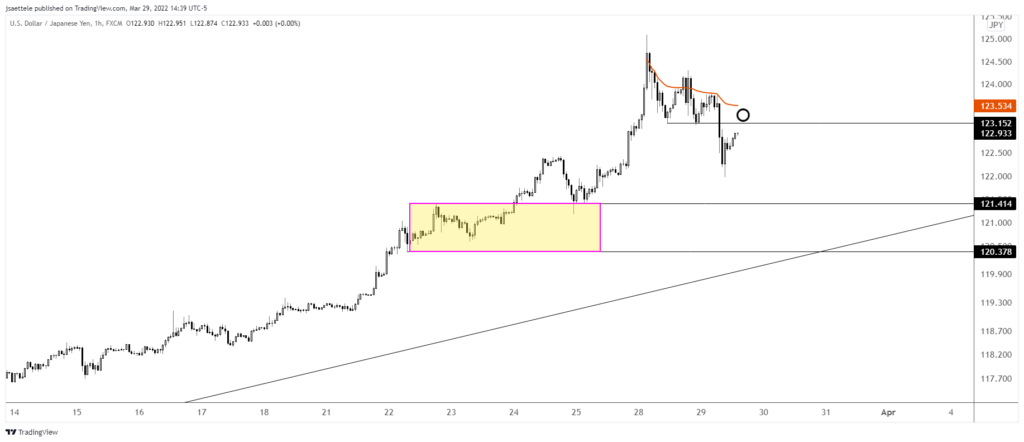
FXY (Japanese Yen ETF) completed a 2 bar volume reversal today. I’ve highlighted all of the bullish reversals since 2016. All but one of the signals nailed the turn. Signals on the other side were reliable as well. Be aware that this chart plots JPYUSD so bullish signals are bearish USDJPY signals. On the spot chart (see below), 123.15/50 should provide resistance if a tradeable high is in place. The top of this zone is VWAP from the high, which has proved useful so far in identifying resistance. The next levels of interest on the downside are 121.40 and 120.40.
USDJPY HOURLY