Scandex Technical Weekly: 11/1/2020
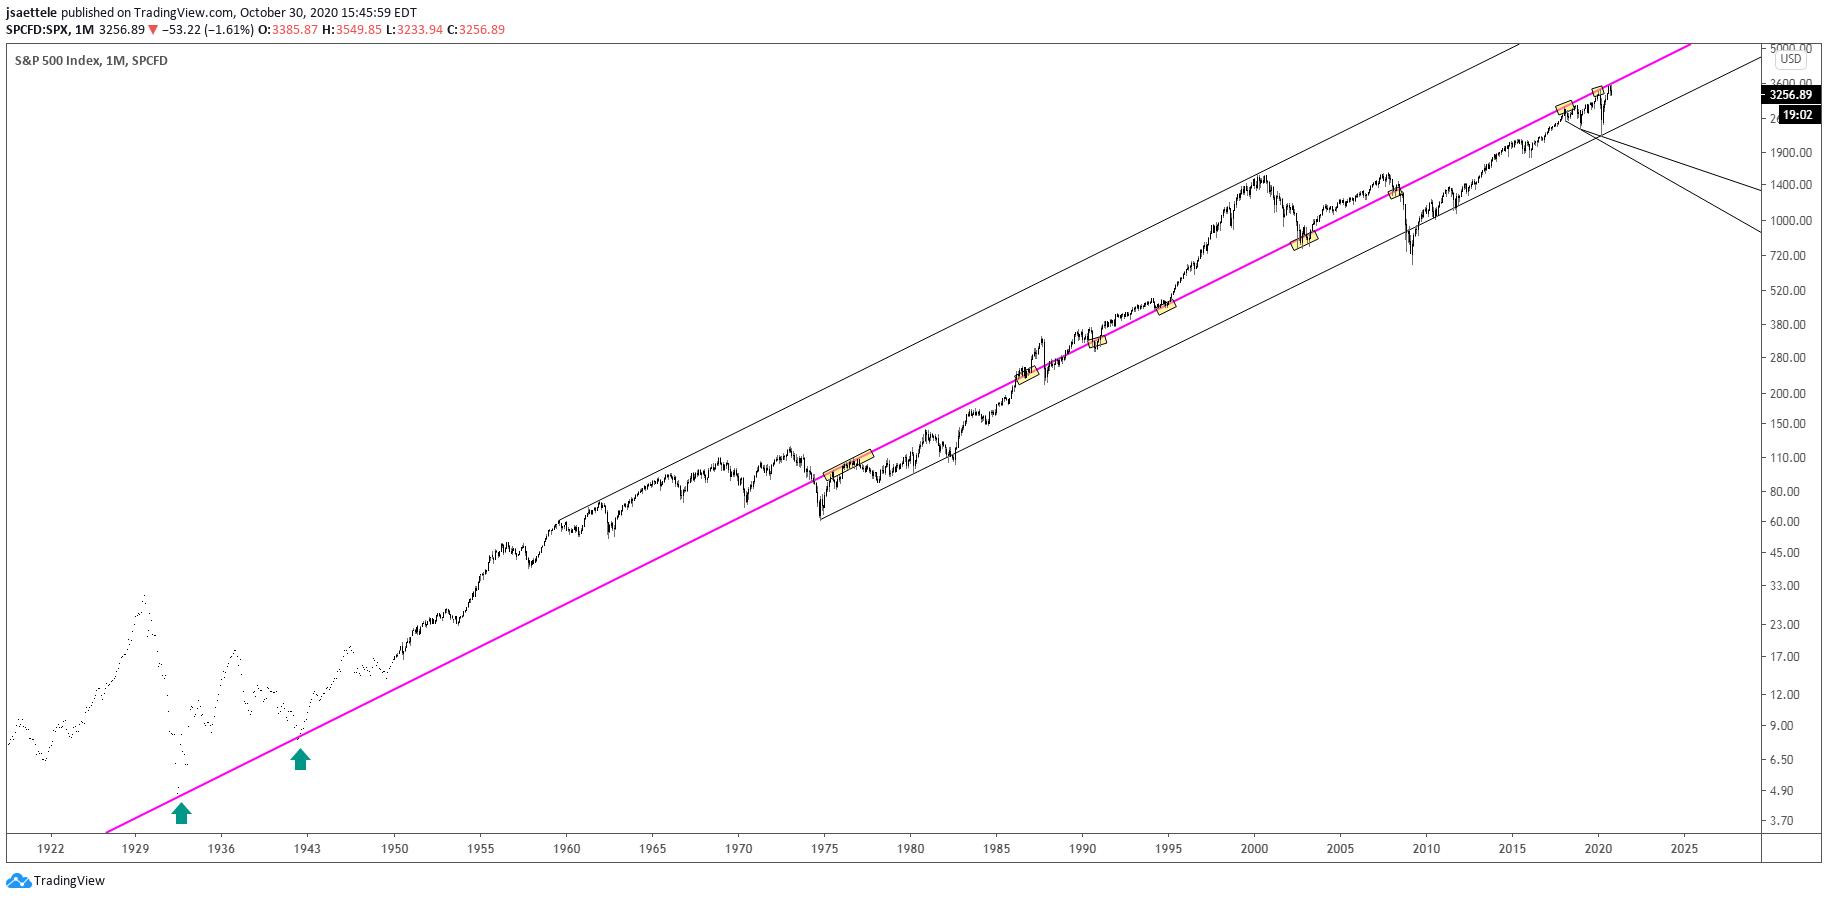
SPX MONTHLY

Another month is in the books and SPX continues to trade ‘heavily’ under the its ‘meridian line’. An inside month formed in October. Recall that September was an outside bearish month (see the close up view below). Of note is XHB (homebuilders), which made a monthly volume reversal in October (see below). Is this one of the last segments of the market to put in a top?
SPX MONTHLY CLOSE UP

XHB MONTHLY

QQQ MONTHLY

QQQ made an inside month in October. The red and blue dots on this chart indicate my ‘inside BB’ setup. This occurs when price makes an inside month and the prior month’s high/low is higher/lower than the upper/lower Bollinger Band. The signals for QQQ have been timely to say the least! Considering the importance of the tech sector to the overall market, I’m not taking this signal lightly. Near term, noted support held on Friday and a 4 hour volume reversal triggered on Friday (see below). Respect bounce potential with resistance near 11420s. The next tradable support is 10350s. These levels are anchored VWAPS.
10/26 – I’m treating the area around 11600 as near term bull/bear dividing line for Nasdaq futures. As long as price is below this level, I am looking lower. 10989 is a level to be aware of within the range with broader focus on 10300-10442. This is the 7/24 low and 2 equal legs down from the September high.
NASDAQ FUTURES (NQ) 4 HOUR

U.S. DOLLAR INDEX FUTURES MONTHLY

DXY made an inside month in October. All of DM FX made inside months except for AUDUSD, which undercut its September low by 4 pips on the 2nd to last day of the month. Nothing has changed regarding the ‘call’ for upside. It’s worth reviewing what I wrote after September.
“It’s a new month which means we monthly volume signals, which are obviously rare. DX futures made a 2 bar monthly volume reversal. This means that August was a high volume up month and at least a 12 month closing high and September was a high volume down month (go here for more on volume indicators). This is the first bullish signal since December 2010. UUP ( Dollar ETF) also made a monthly volume reversal (see below). Price history begins in 2007 but this is the 4th bullish reversal since then. The prior 3 nailed major turns. The 2 bearish reversals also nailed turns.”
10/28 – DXY finally closed above the trendline from the March high. The top side of the line is now proposed support near 93.20. Broad focus is still towards 96-97 although 94.75 is a possible reaction level. Keep it simple…DXY held long term support (see below) and just broke above a 7 month trendline. That’s bullish.
UUP MONTHLY

DXY SEASONALITY

Guess what? The next 3-4 weeks are some of the most bullish weeks historically for DXY. The histogram below displays seasonality in a different format. Bottom line, there is a strong seasonal tailwind for the USD in November.
DXY SEASONALITY HISTOGRAM

EURUSD MONTHLY

The noted 1.1480/95 is reinforced by VWAP from the March low (see below). This is a major level and where EURUSD could resume higher. Failure to hold that level would suggest a deeper setback…maybe into the 61.8% retrace at 1.1160. I’ll entertain that scenario if warranted. 1.1750 is still proposed near term resistance. Note that the ‘inside BB’ setup triggered in October for EURUSD. Bullish signals have fared better than bearish signals since inception of the EURUSD but it’s worth sharing given the volume signals in DXY and UUP, and the fact that EURUSD has reversed from longer term resistance.
10/29 – EURUSD focus remains on 1.1480/95. A bounce into the well-defined 1.1750 would present a high reward/risk bearish entry (allows for a tight stop).
EURO FUTURES DAILY


