Market Update 3/30 – Interesting EURUSD Structure into Month End
DXY 4 HOUR
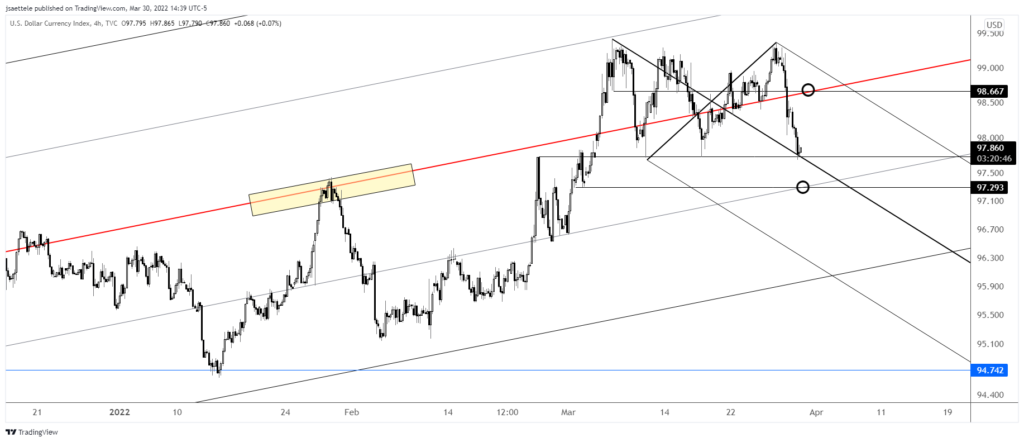
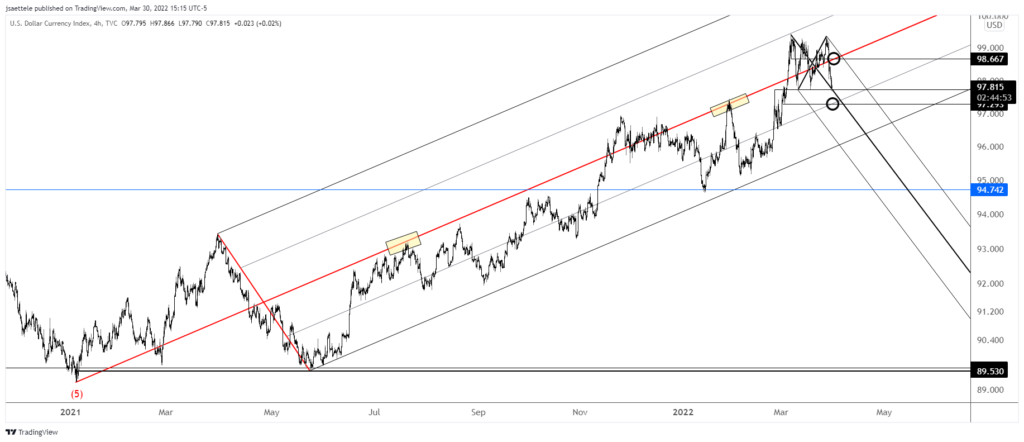
DXY is testing 97.86 once again. This level was resistance in late February and has been support throughout March. I’m expecting a break but if price bounces again then pay attention to the median line (red line) from the fork that originates at the 2021 low (zoomed out chart is below) near 98.67. If price breaks down now then 97.30 or so is a candidate for a bounce level at which point 97.86 would become resistance. Finally, tomorrow is month and quarter end and it’s not uncommon to see spikes in both directions into options expiration and the European close. A spike towards USD strength during this time would be an amazing opportunity to sell USD for April…which is one of the weaker months historically.
3/17 – DXY has retraced all of last week’s rally. The median line (red line) from the fork that originates at the 2021 low is a key level to know for resistance now near 98.37. The next downside level of interest is 97.00ish. Remember that seasonal tendencies are now bearish.
DXY 4 HOUR
EURUSD HOURLY
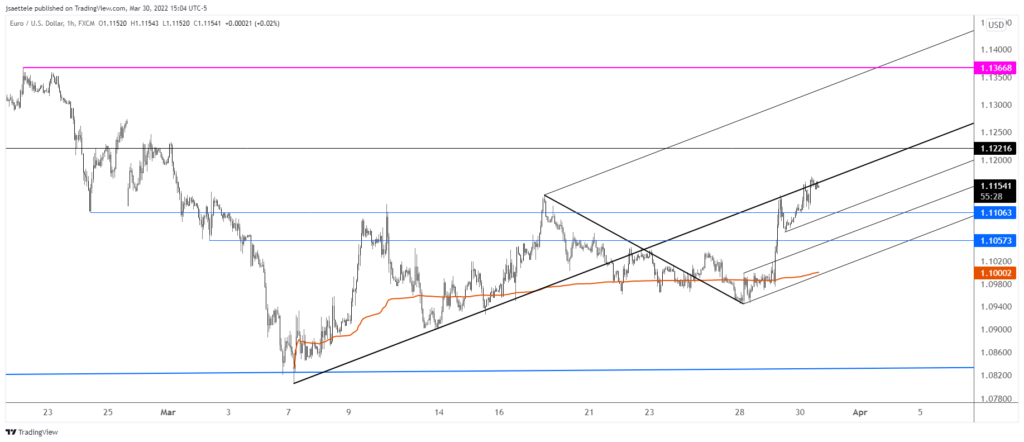
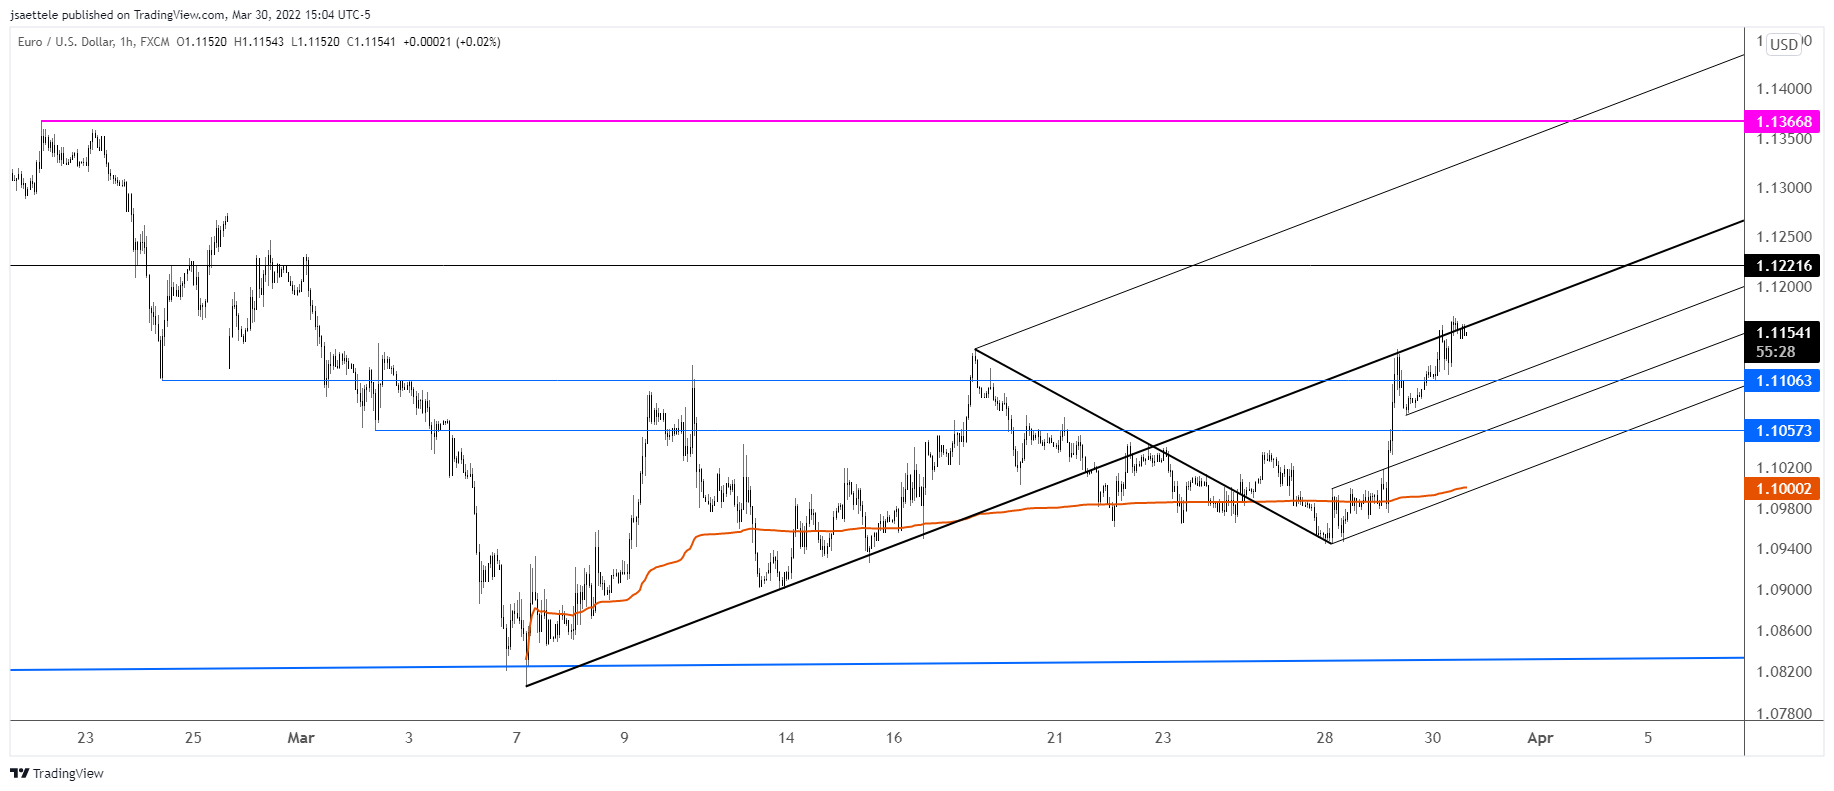
1.1218/30 remains in focus but I’m wondering if EURUSD is trading within a much more bullish structure. Notice how price has been riding the median line of the presented fork the last 2 days. This suggests that the structure is ‘in play’. So, either price pulls back and finds support on a related parallel…probably near 1.1106 or 1.1060 or EURUSD explodes higher now. If the latter happens, then the top side of the center line becomes proposed support.
3/29 – EURUSD broke above short term trendline resistance so focus is squarely on 1.1218/30. It’ll be interesting to see how we finish out the month. It’s possible that EURUSD leaves a very bullish monthly candle (long lower wick). Watch for support in the 1.1040s.
USDJPY HOURLY
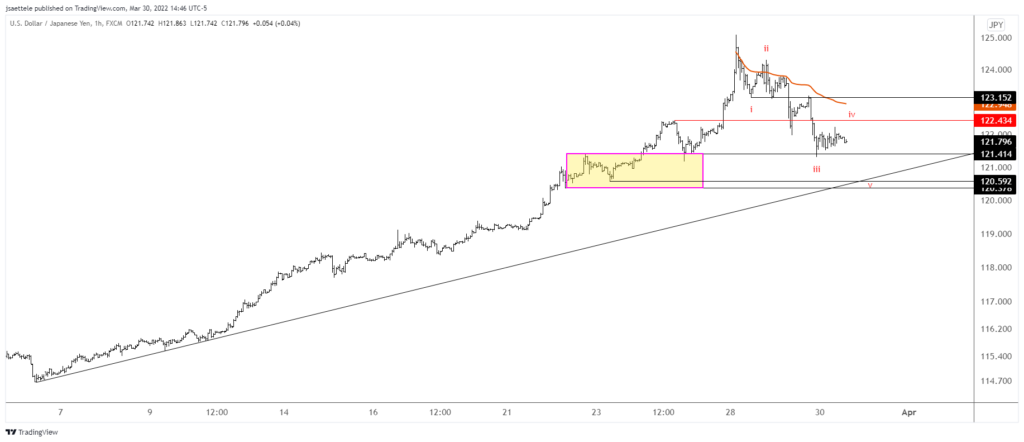
A possible short term count for USDJPY is shown. Under this scenario, a small 4th wave would end near 122.40 before a 5th wave drop into 120.40/60. At that point, a larger 3 wave bounce would take place into a lower high (against this week’s high).
3/29 – FXY (Japanese Yen ETF) completed a 2 bar volume reversal today. I’ve highlighted all of the bullish reversals since 2016. All but one of the signals nailed the turn. Signals on the other side were reliable as well. Be aware that this chart plots JPYUSD so bullish signals are bearish USDJPY signals. On the spot chart (see below), 123.15/50 should provide resistance if a tradeable high is in place. The top of this zone is VWAP from the high, which has proved useful so far in identifying resistance. The next levels of interest on the downside are 121.40 and 120.40.
USDCAD 4 HOUR
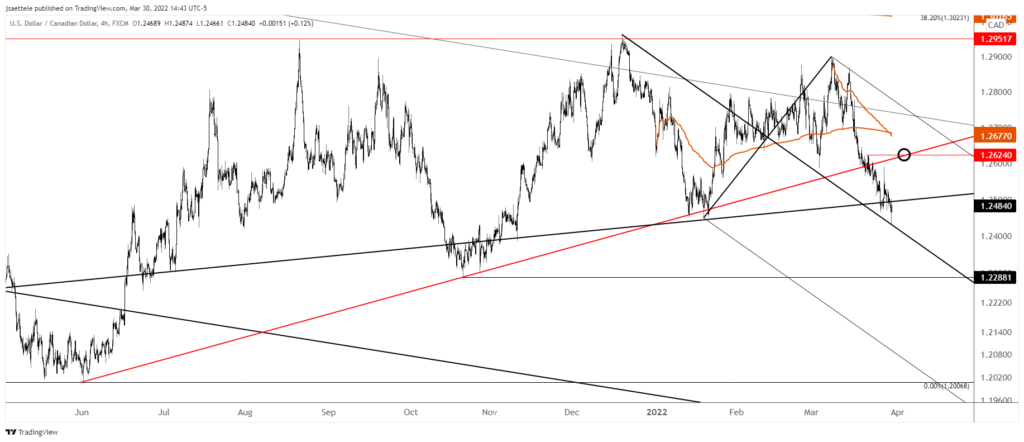
I still favor selling USDCAD into the underside of the broken trendline (red line). That line is about 1.2625 now. Maybe we finally get a bounce to do just that since price tested the median line from a new structure today.
3/28 – USDCAD broke the trendline from the June 2021 low last week. The underside of that line was nearly reached today near 1.2605. This is also the 200 day average. I’d love a tag of that line in order to short for resumption of the ‘new’ bearish trend (as suggested by the trendline break).

