Market Update 12/27 – AUD and CAD are Constructive into Year-End
EURUSD 4 HOUR
The last week of the year is often the quietest week of the year. That said, I want to stay abreast of what is happening so I’ll have updates this week.
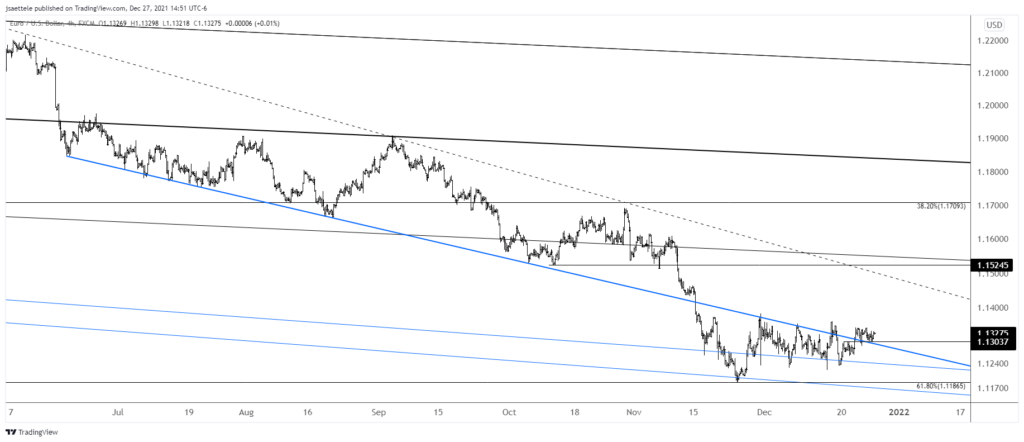
EURUSD is trading above the bullish ‘trigger line’ but the action is clearly subdued given the last week of the year action. I am bullish EURUSD but it doesn’t make sense to do anything right now.
12/22 – EURUSD is once again flirting with an important breakout above the trigger line. Price is more or less right at the line now. Again, a break above is needed in order to indicate an important behavior change. Ideally, price rises a bit more before pulling back to the line near 1.1300 and holding it as support. That’s the setup at least! Near term upside remains about 1.1520.
USDJPY DAILY
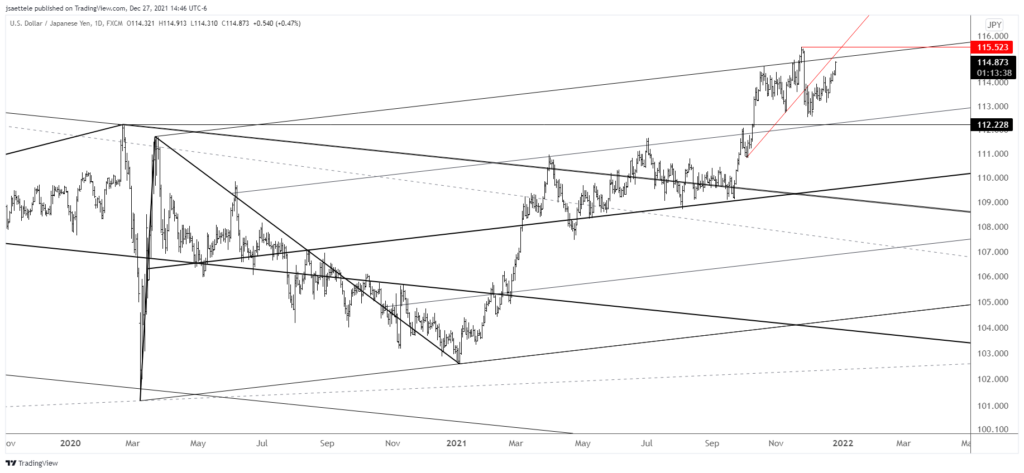
I’m wondering if USDJPY is going for a re-test and failure of the November high. Remember, the 61.8% retrace of the decline from 2015 is 115.52. Also, the rally from March 2020 channels perfectly.
AUDUSD 4 HOUR
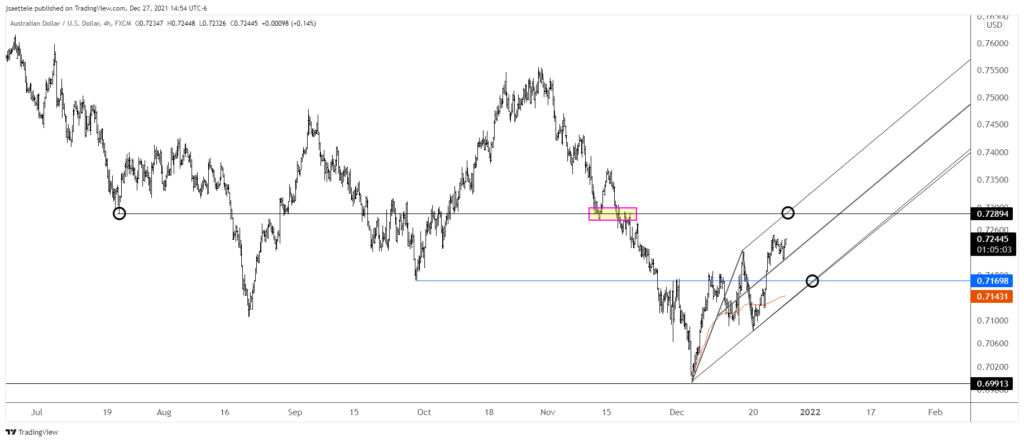
AUDUSD continues to make progress within what I believe is a new bullish sequence. As such, focus is on identifying support to buy. .7170 sticks out as the ideal level. This has been an important horizontal level since the September low. The price intersects short term channel support at the end of this week (and year). Maybe we get a big buying opportunity right at the beginning of 2022! .7290 or so is still proposed resistance for a pullback.
12/15 – Aussie never made it to .7060s but the non-confirmation with NZDUSD that was discussed the last few days is in place. Initial upside focus is 2 equal legs up from the low at .7284. This has been a well-defined level for over the last few months. .7125/43 is proposed support.
USDCAD WEEKLY
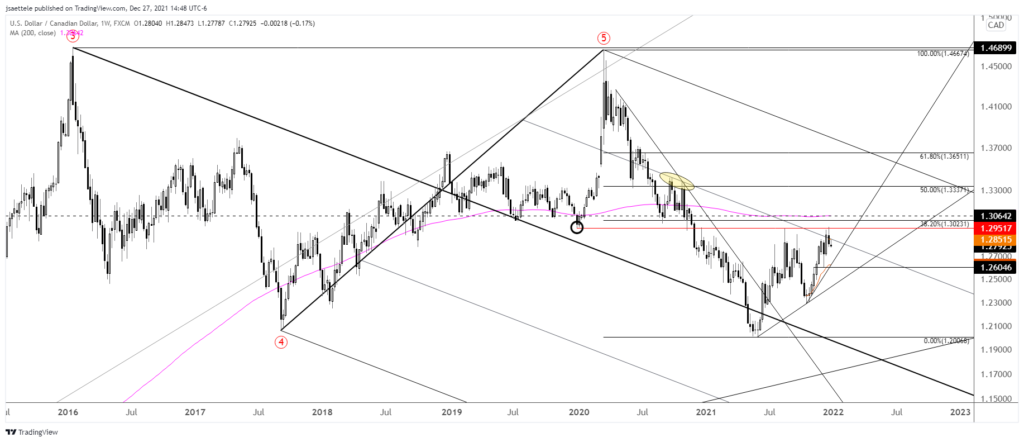
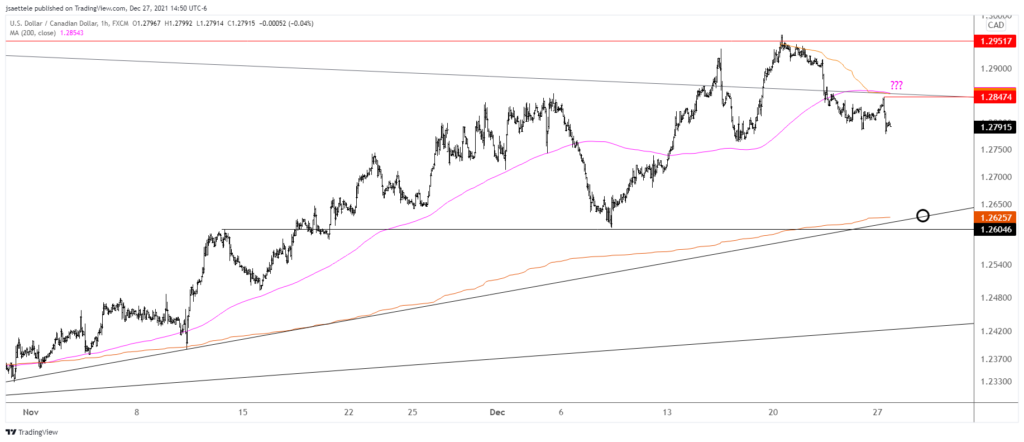
Last week, USDCAD finally spiked through 1.2952 and reversed. In fact, the level is also defined by the December 2019 low. There is also the 25 line, which was resistance for several important highs in 2020. In other words, this is a great spot for a big top. Near term focus for resistance is 1.2850 (see below).
12/15 – USDCAD didn’t quite reach 1.2952 but today’s reversal certainly classifies a ‘violent’. This is a close-up of yesterday’s chart. I’m looking lower towards 1.2605, which is last week’s low and near VWAP from the October low. Proposed resistance is 1.2869/97.
USDCAD HOURLY
