Market Update – May 8
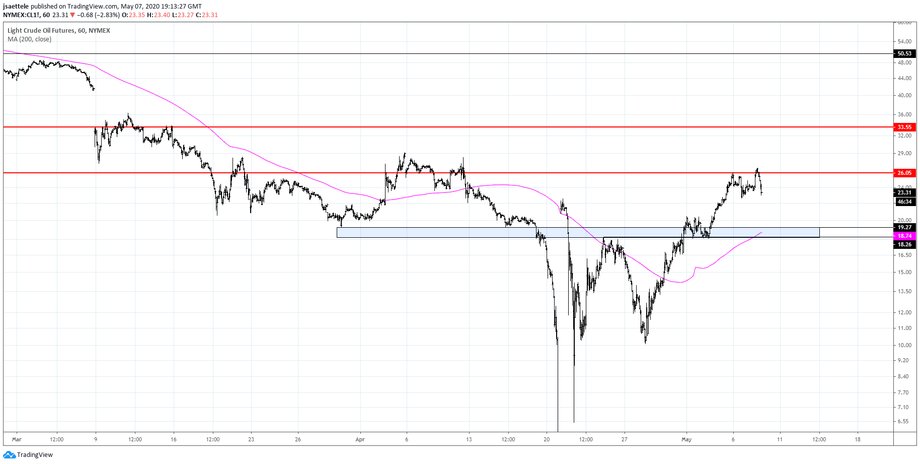
CRUDE OIL HOURLY
WTI traded into the 2016 low today and reversed lower. My working assumption is that crude is building a bullish base. 18.20-19.20 is the zone to watch for the next low. This zone is defined by support and resistance since late March. USDNOK and USDRUB are 2 ways to play an eventual oil recovery. The chart below shows crude, RUB, and NOK for close to the last 2 years. USDNOK is a cleaner short in my opinion, which I discuss below.
CRUDE OIL (BLACK) RUBUSD (RED) AND NOKUSD (BLUE) 4 HOUR

USDNOK 4 HOUR

USDNOK declined in 5 waves from the March high. Since the April low, we’ve seen an up leg and down leg. My thinking is that these are waves A and B of a flat, primarily because of oil’s reversal from the 2016 low today. If this plays out as I suspect, then there will be a tremendous short opportunity in USDNOK at 11.2160-11.3629. On a long term basis, a 12 year advance may have ended at the March high as per the 5 wave rally from the April 2008 low (see below).
USDNOK WEEKLY

EURUSD 4 HOUR

It’s all about the levels! EURUSD turned up from the same spot that was support in February and April (twice). I have no opinion on whether or not everything since the March low is a bullish base or consolidation before another leg lower but I am bullish against today’s low. Initial focus is 1.0900/25. 1.0790-1.0810 is proposed support for Friday.
AUDUSD 4 HOUR

I’m getting sliced and diced in commodity currencies right now. Even so, I still lean towards the downside in AUDUSD. Reasons for my view include 5 waves up from the March low and the most seasonally bearish period of the year through May 22nd. The month open at .6510 was nearly reached today but I’m watching the underside of the April trendline for resistance now at .6530/40.
EURAUD 4 HOUR

EURAUD is back near the lows but did react today to the top side of the line off of the 4/5 and 4/21 highs. Former resistance acting as support? The 200 day average is just ticks from the low at 1.6539. Maybe that’s tested before an attempt higher. Bottom line, I ‘like’ EURAUD higher but don’t have an entry planned yet.
5/5 – EURAUD has broken through the wedge and the top side of the wedge line is now proposed support along with the 78.6% retrace at 1.6680. Remember, price turned up last week from just above the 200 day average. If price finds a higher low, then upside levels of interest will be 1.7308, 1.7784, and eventually 1.8435-1.8608!
USDJPY HOURLY

USDJPY is slowly making it’s way to the cited target at 105.19. Near term, I could see another attempt higher to test 106.93, which was support in April and the 61.8% retrace of the drop from 4/30. A rally into there would present an opportunity to increase short exposure.
5/5 – USDJPY is nearing the center line of the channel from the 4/6 high. When a market is nearing the center line, I’m always on the lookout for acceleration in the trend…in this case that’s lower. Focus remains towards the lower channel and 61.8% retrace of the rally from the March low at 105.19. Also, BoJ assets are significantly lagging Fed assets, which should pressure the cross lower (see below).


