Market Update: October 1 – Important Monthly USD Signal
U.S. DOLLAR INDEX FUTURES MONTHLY

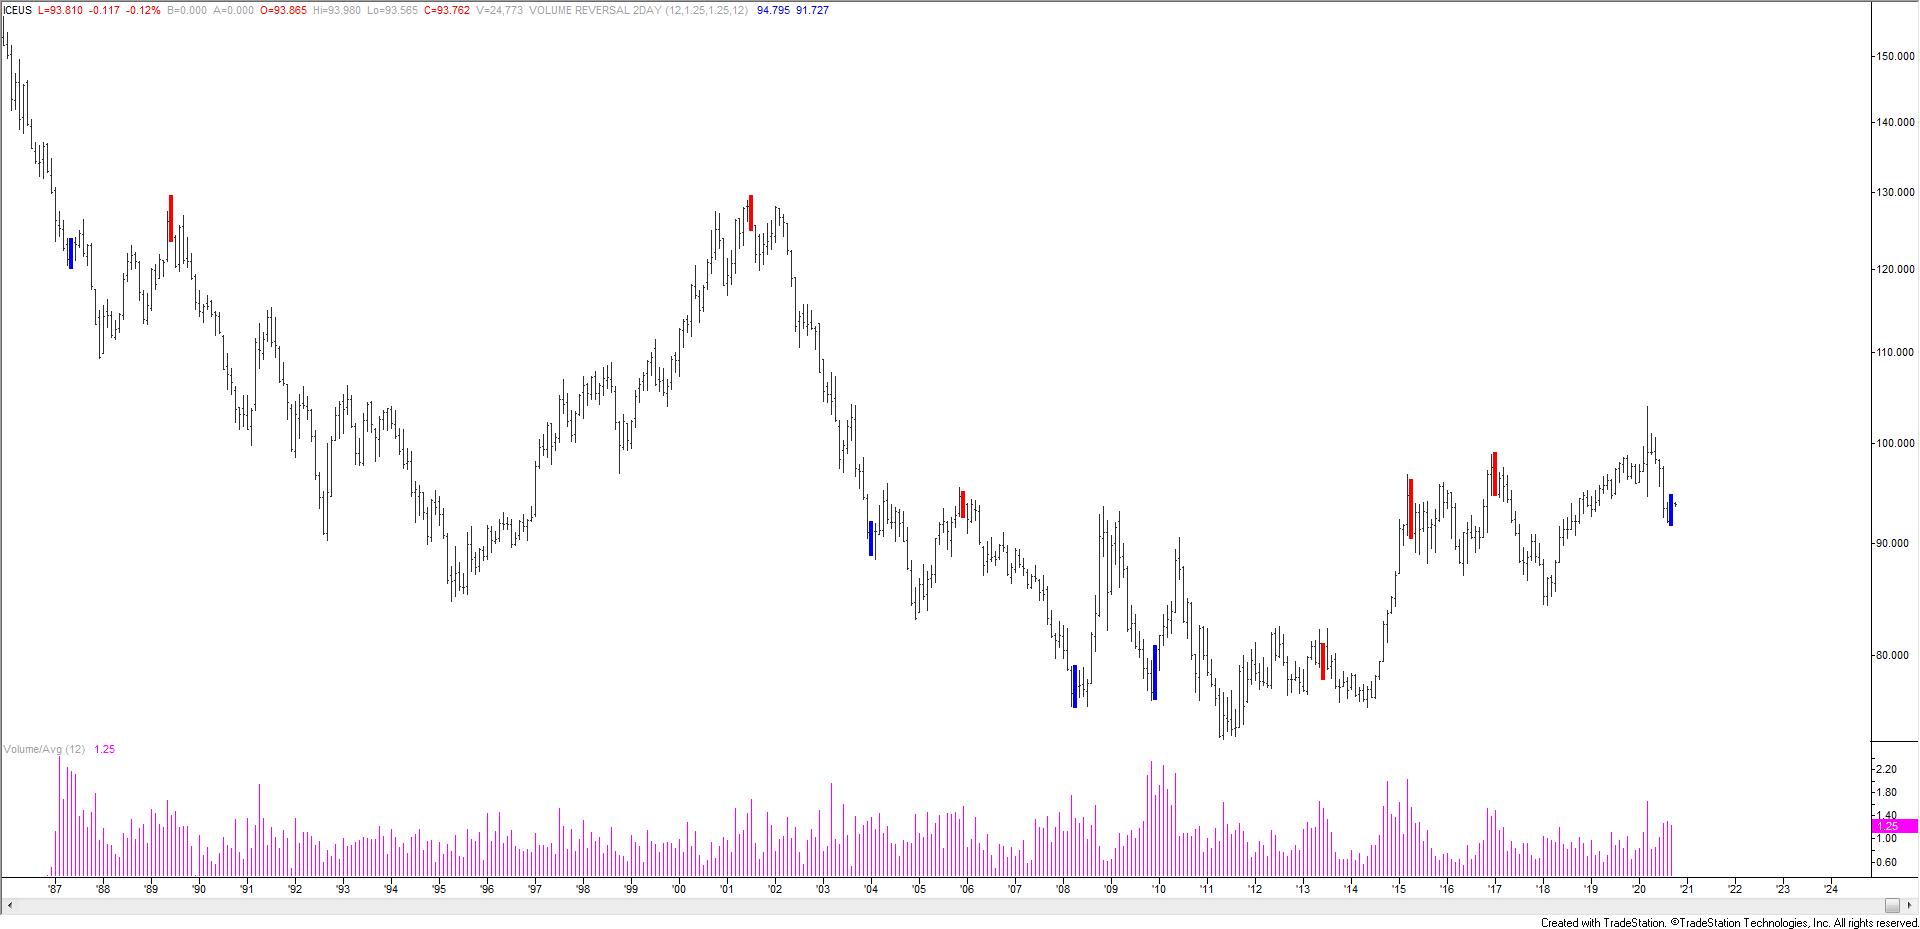
It’s a new month which means we monthly volume signals, which are obviously rare. DX futures made a 2 bar monthly volume reversal. This means that August was a high volume up month and at least a 12 month closing high and September was a high volume down month (go here for more on volume indicators). This is the first bullish signal since December 2010. UUP ( Dollar ETF) also made a monthly volume reversal (see below). Price history begins in 2007 but this is the 4th bullish reversal since then. The prior 3 nailed major turns. The 2 bearish reversals also nailed turns.
UUP MONTHLY

USDOLLAR 4 HOUR

USDOLLAR has reached and reacted to the breakout level (neckline). I am bullish…now…especially when viewed in the context of the longer term bullish reversals noted above.
9/29 – We looked at DXY yesterday, remember that the neckline is 93.50 and proposed support for that index. USDOLLAR is nearly identical with the neckline near 12040. I’m in the re-test of the breakout level (neckline) and then higher for the USD.
DXY 4 HOUR

Different USD index but the same story. Price tested the breakout level today (low was 93.52). Maybe DXY spikes lower on NFP before reversing higher in earnest but I am a bull. In fact, a spike lower to test VWAP from the September low would make sense.
9/28 – DXY is starting to pull back from the well-defined 94.70. The top side of the neckline from the completed bullish head and shoulders pattern is ideal support near 93.50. I’m still bullish the USD but welcome a dip to that level to ‘reset’ the market for the next leg higher.
U.S. DOLLAR INDEX FUTURES HOURLY

AUDJPY 4 HOUR

AUDJPY broke short term trendline support on 9/16. The recovery over the last week simply serves to correct short term oversold conditions. Focus for resistance is 76.40 (200 period average on 4 hour chart and trendline). Downside focus is the top side of the trendline from the 2018 high near 71.35 (38.2% retrace of rally from March low).
CRUDE OIL FUTURES 4 HOUR

Crude has been sideways since June but today’s drop raises the specter that trading for the last 3 or so months is a broad top. I’m looking towards 34.00/50 and will then reassess, which is the short term channel low and a well-defined pivot from May/June.
DJIA CURRENT AND 1929 DAILY

Coincidence? Price pattern in ‘the Dow’ continues to closely track the 1929 market. If this resumes, then the market should roll over in the next few days and come close to the March low by the end of the month. I’ll have more on October panics next week.


