Market Update 8/5 – Watch USDTRY Up Here
USDCAD 4 HOUR
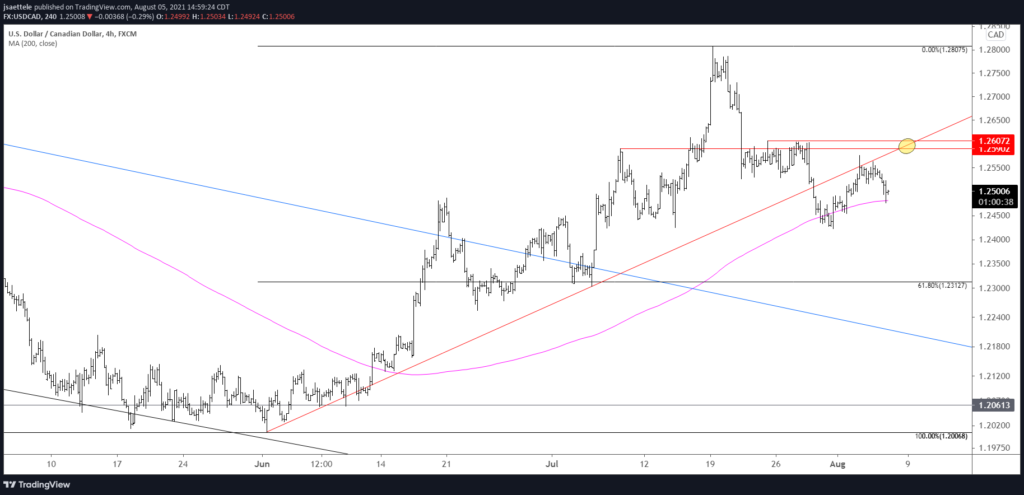
It was a quiet day in the majors today as participants wait for NFP tomorrow. The Canadian jobs report will also be released so keep an eye on USDCAD. Price has come off following the test of the underside of the former trendline. With both reports due tomorrow, respect potential for another run on the underside of the trendline. The line now aligns with horizontal resistance in the 1.2590-1.2607 zone.
8/3 – The underside of the short term trendline provided resistance today in USDCAD. As such, I’m bearish against today’s high and looking towards the noted 1.2300/13. Keep it simple!
USDCHF 4 HOUR
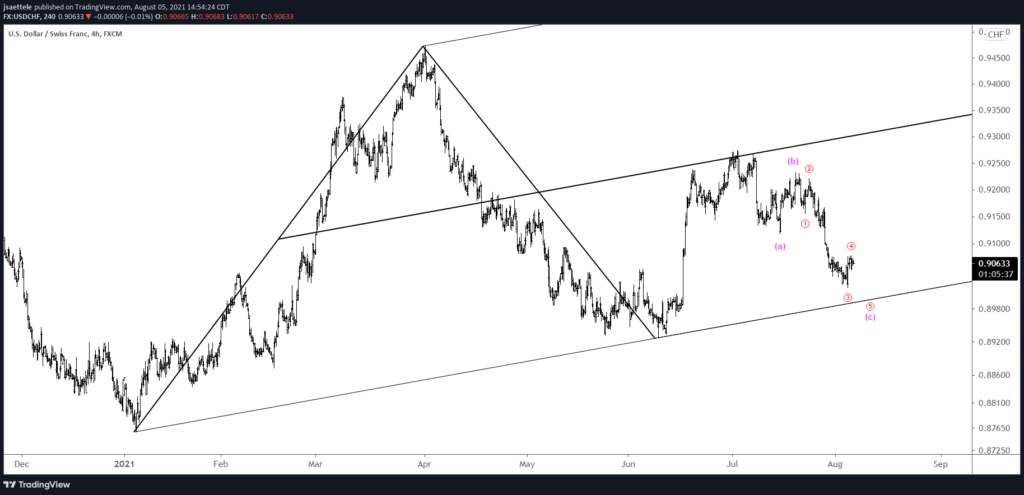
USDCHF did not hold ‘ideal’ support (low on Wednesday was .9018). Price did reverse higher on Wednesday but one more drop could complete 5 waves down from the 7/20 high. Specifically, the drop would compose wave C and complete 3 waves down from the 7/2 high. The lower parallel from the channel off of the January low is about .8990. Watch that level for support.
7/27 – USDCHF could help time the next USD low. To recap, price rallied in 5 waves from the January low the experienced a deep pullback. The rally from June appears impulsive and weakness from the July high is unfolding in 3 waves. Ideal support is .9059/75, which includes the 61.8% retrace of the rally from January, 2 equal legs down from the July high, and the 200 day average.
USDTRY 4 HOUR
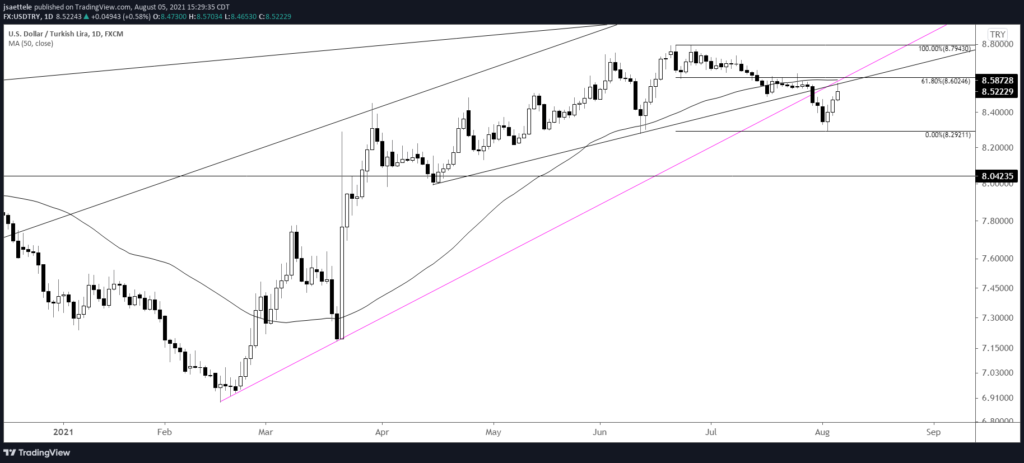
USDTRY has reached the bottom of the proposed resistance zone allow for one more push to test the 61.8% retrace of the decline from the June high. That level is 8.6044. The 50 day average is just below that level. Don’t forget about the contrarian implications from The Economist cover!
8/2 – One place to look for EM out-performance in the Turkish Lira. USDTRY has trended higher (higher USD and lower TRY) with little interruption for over a decade. A massive double top is possible given the failed move after posting an all-time high. Proposed resistance for short entry is 8.57-8.58.
GBPJPY DAILY
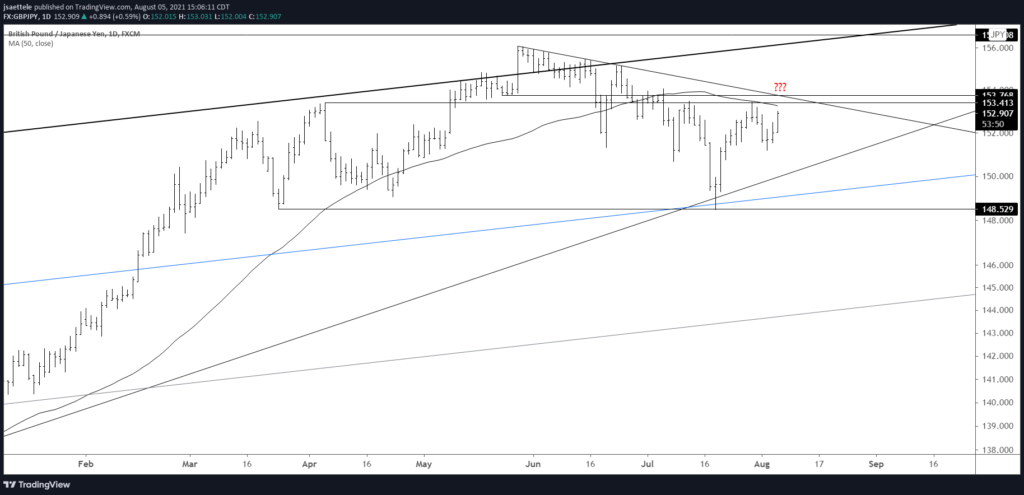
Recall that USDJPY 110 is an important level (see yesterday’s post). With that in mind, there are several other Yen crosses that are nearing possible inflection points (or important range expansions). GBPJPY 153.40/80 is a zone to know. The 50 day average, a host of daily highs/lows, and the trendline from the May high define the zone.
NZDJPY DAILY
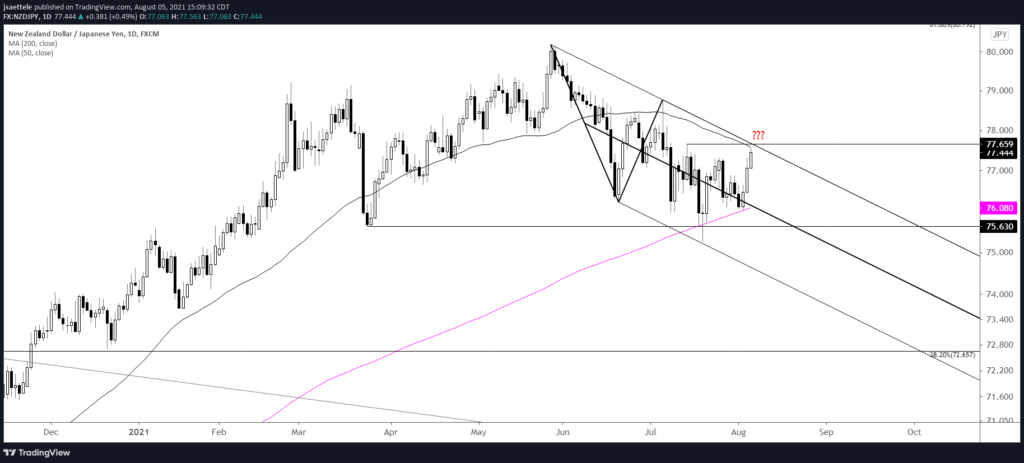
NZDJPY is another Yen cross to pay attention to…especially with the show of NZDUSD resistance near .7100 (see yesterday’s post). Channel resistance intersects the 7/14 high at 77.66 on Friday, which is just above the 50 day average.


