Market Update: January 11
TRADE WEIGHTED USD POSITIONING

The USD has started to turn up and positioning remains extremely short. There is a lot of ammunition in the tank to propel a fantastic short squeeze.
10 YR REAL YIELD AND DXY

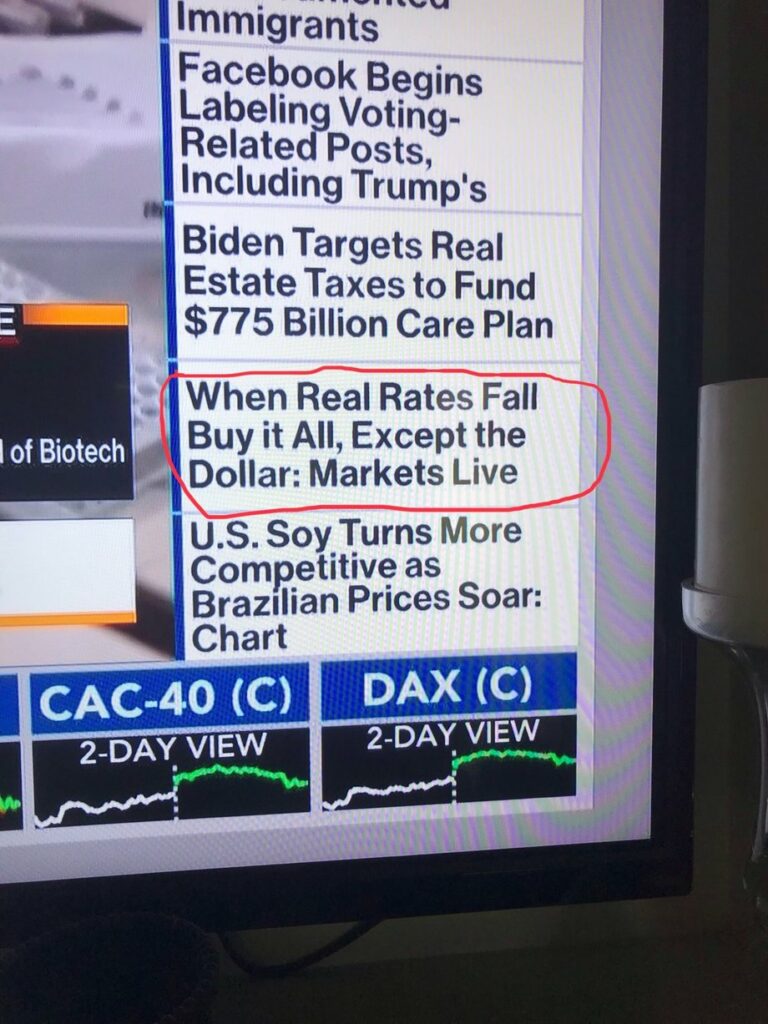
Also, the 10 year real yield has turned up after trading in negative territory for the first time ever. The ‘real yield’ is adjusted for inflation. I consider this a tailwind for the USD.
DXY 4 HOUR

DXY has reached a possible pausing level. The level in question is defined by the 200 period average on the 4 hour chart and the median line from the structure that originates at the 12/17 low. If price does pull back, then I’ll zoom in to identify possible support. If price zooms through this level then the top side of the median line becomes proposed support.
1/10 – NZDUSD has broken a short term trendline, which is the trigger for a short following the turn lower from .7315. The underside of the trendline is now proposed resistance near .7240. .7150 is a possible bounce level but the more important downside level of interest (for now at least) is .7000.
GBPUSD 4 HOUR

Cable near term downside focus is 1.3130/90. This zone has been important for the last few years (highlighted) and is also the line that extends off of the May and June lows. Pay attention to 1.3580 if reached for resistance. This is VWAP from the high and 2021 VWAP (see futures chart below).
1/4 – Cable tagged the Brexit day close (6/24/2016) and reversed sharply lower today. The Brexit day close identified the September 2017 high. Price sold off 6 big figures from that high. Again, the median line from the structure that originates at the Brexit spike low is here as well along with the line off of the March and December 2019 highs. I am looking lower. Watch for resistance at 1.3630/45.
BRITISH POUND FUTURES HOURLY

AUDUSD 4 HOUR

AUDUSD has broken a short term trendline and the underside of that line is now proposed resistance near .7750. .7620 is a possible bounce level (as well as the next breakdown level). .7750 is reinforced by VWAP from the high and 2021 VWAP (see futures chart 2 charts down). It’s important to note that AUDUSD is reacting an important long term level (see weekly chart below).
AUDUSD WEEKLY

AUSTRALIAN DOLLAR FUTURES HOURLY

NZDUSD 4 HOUR

The center line of the channel from the March low (red line) in NZDUSD has been support and is now proposed resistance near .7225. The 25 line is a possible bounce level at .7100. The ‘real’ test for bulls is the lower parallel near .7000. Proposed resistance is reinforced by VWAP from the high and 2021 VWAP (see 2 charts down).
1/10 – NZDUSD has broken a short term trendline, which is the trigger for a short following the turn lower from .7315. The underside of the trendline is now proposed resistance near .7240. .7150 is a possible bounce level but the more important downside level of interest (for now at least) is .7000.
NZDUSD HOURLY

NEW ZEALAND DOLLAR HOURLY


