Market Update 2/28 – Weekly Reversals!
DIA WEEKLY
DIA (Dow Jones Industrials ETF) made a weekly volume reversal last week. There have been a number of bullish reversals over the years but only one other bearish reversal that satisfies the requirements met last week (at least a one year high and a reversal on at least 1.8 x the 13 week average of volume). The other bearish reversal was the week of the 2000 high.
TLT DAILY
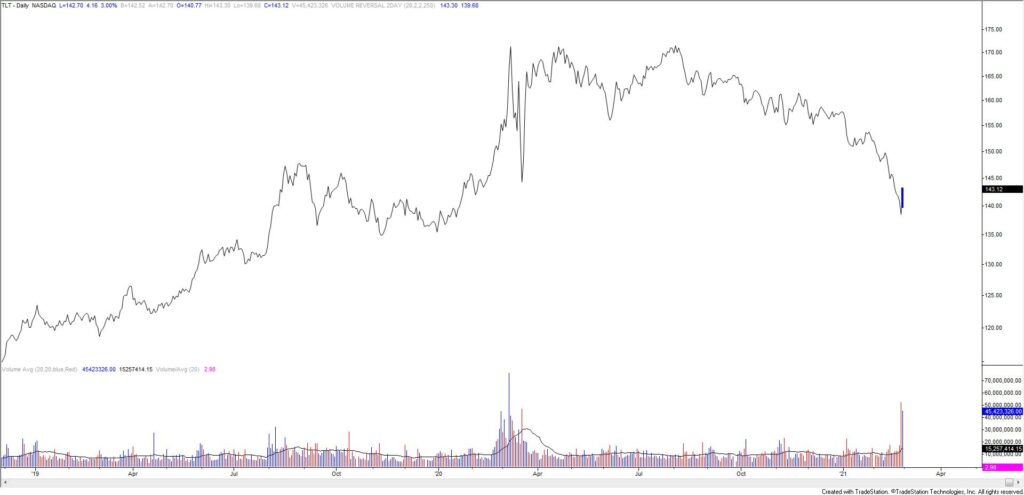
TLT reversed sharply at the end of last week, making a 2 day volume reversal. The only other bullish reversals that satisfy the requirements met last week occurred at the 2003 and 2007 lows (see next chart). This recent action is consistent with last week’s call for a low in TLT (high in bonds). Initial upside focus is 149ish.
2/24 – TLT tagged the March low today (also the 2015 high). Big spot. RSI is 20.97. Readings this low (magenta dots) are rare and have occurred either at or just before big lows (see the chart below as well). Remember, lower TLT indicates higher yield and higher TLT indicates lower yield. In other words, this chart ‘fits’ with the 30 year yield chart.
TLT DAILY

AUSTRALIAN DOLLAR FUTURES WEEKLY
AUDUSD followed through on its daily reversal last week and ended up with a weekly volume reversal. The only other weekly volume reversal occurred at the January 2004 high. Price is bouncing from the 50 day average in early week trading. Proposed resistance is .7887, which is the 61.8% retrace of the decline and the center line of the Schiff fork from the March low (see below chart). The next downside level of interest is the lower parallel. That is currently near .7500.
2/25 – Commodity FX reversed sharply lower today. I’m showing all the daily volume reversals for FXA and Australian Dollar futures, and 8 hour reversals on futures for the last 5 years. Given the spike and reversal from .8000 in spot (see weekly chart below), it’s worth a shot on the short side here. Immediate downside focus is the year open at .7695.
AUDUSD 4 HOUR

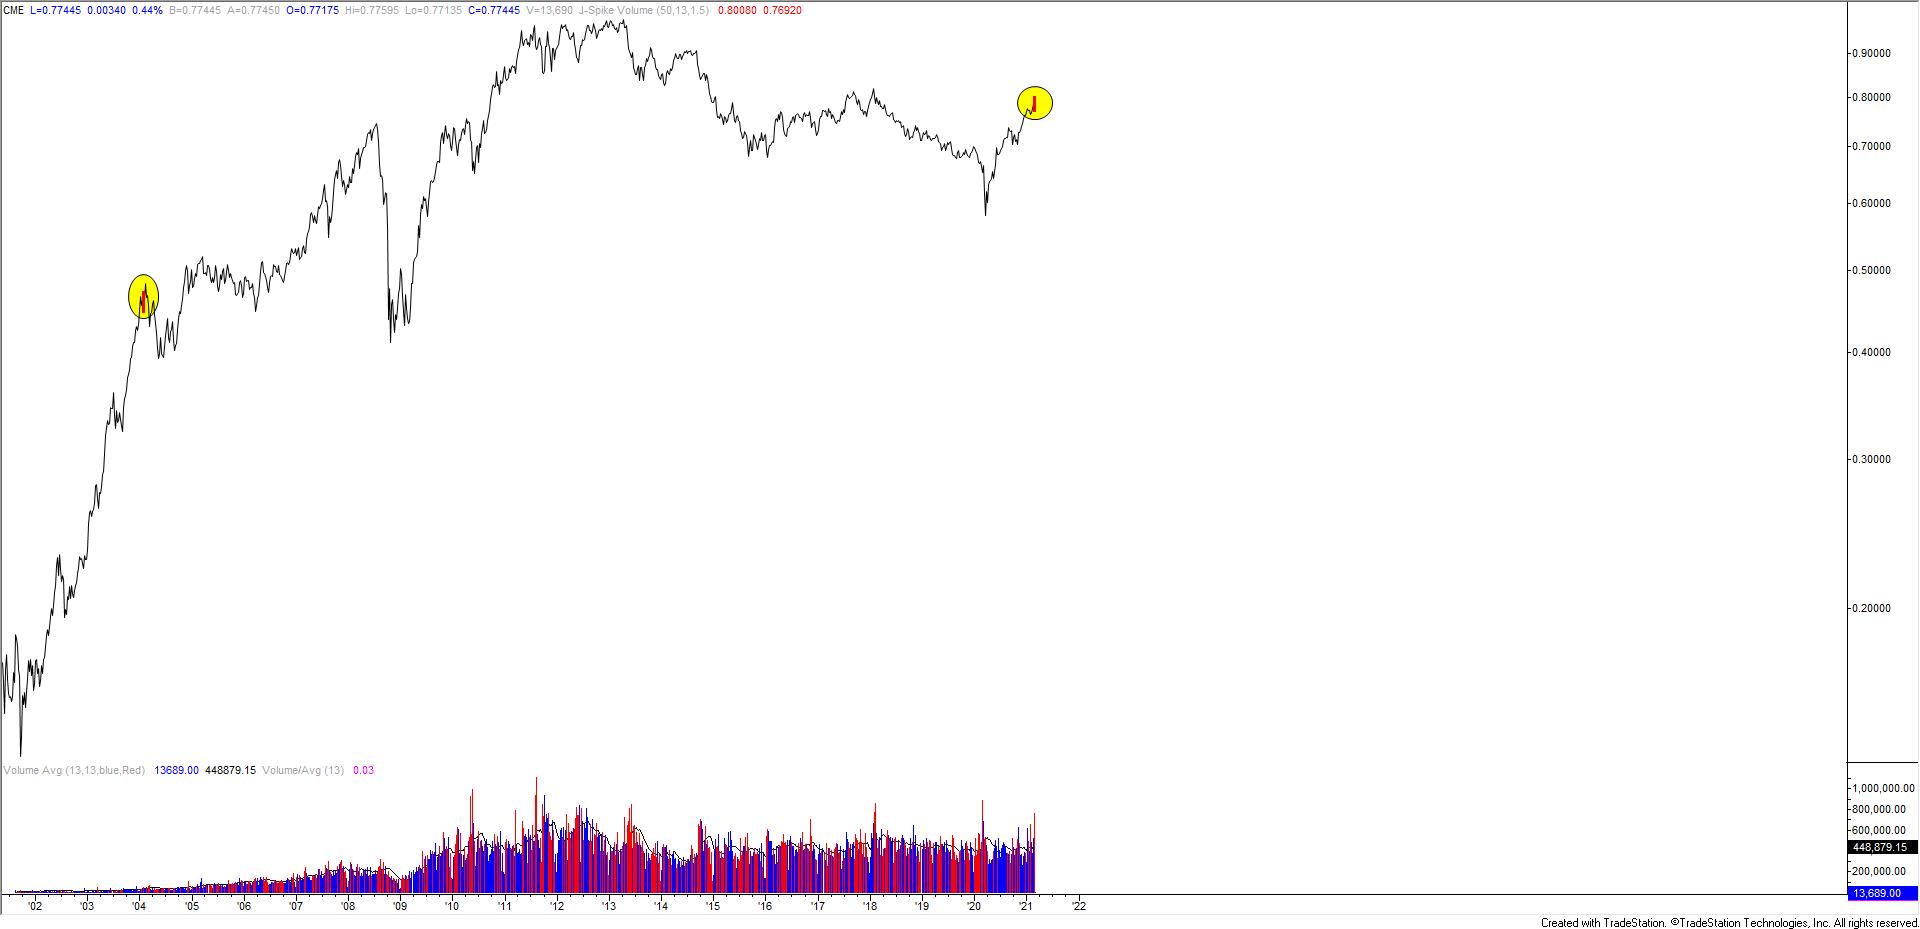
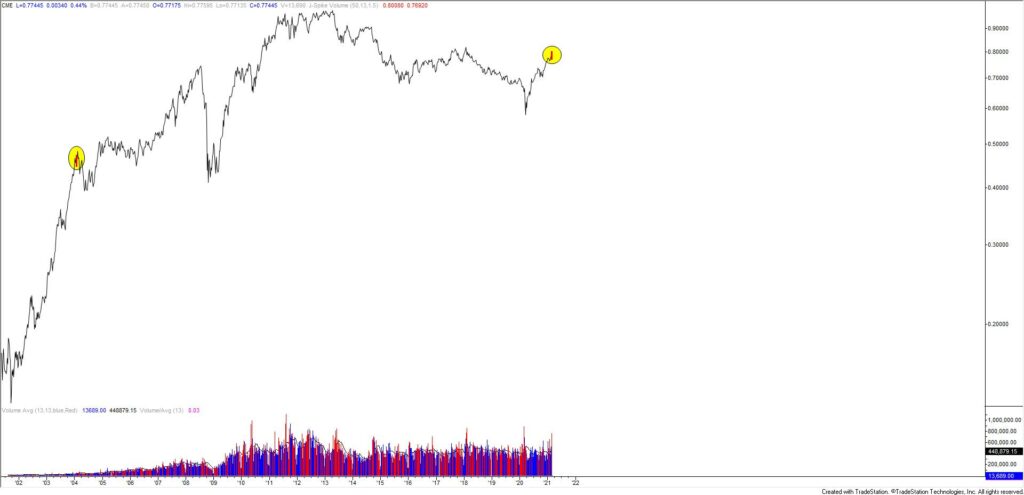
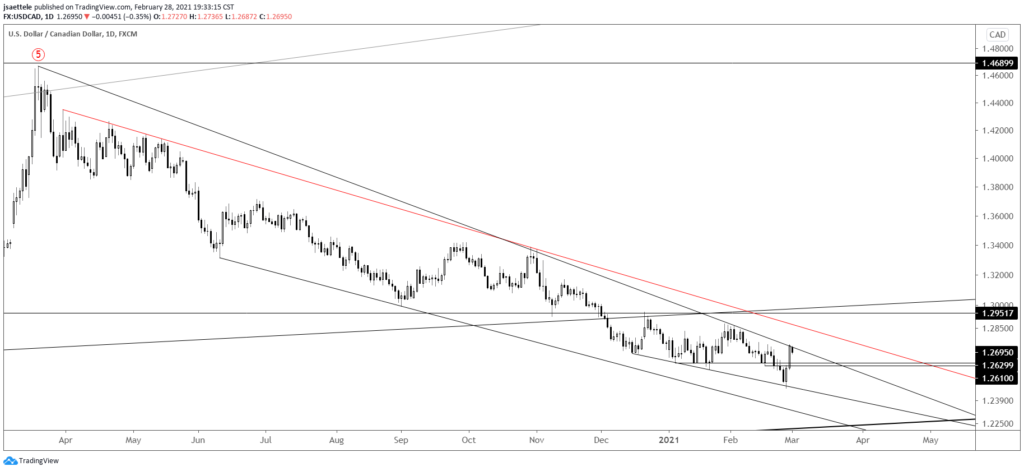
CANADIAN DOLLAR FUTURES WEEKLY

CAD futures made a weekly volume reversal last week. The only other weekly volume reversal at least a one year high with 1.5 x the 13 week average of volume occurred at the January 2016 low. FXC (ETF) has seen a number of weekly volume reversals. Most of those reversals did identify important turns. That chart is below. For USDCAD, price is testing the 50 day average and trendline from the March high. A break above would be important. Until that happens, watch for support near 1.2600.
2/25 – CAD futures also made a volume reversal today (remember that CAD futures is quoted as the inverse to USDCAD). All daily reversals are shown in this chart and the one below. USDCAD (see 2 charts down) has responded to the 38.2% retrace of the rally from the 2007 low. Today’s low is also just under the April 2018 low and ticks above the May 2016 low. Given the well-defined level and volume reversal on futures, I favor upside in USDCAD now.
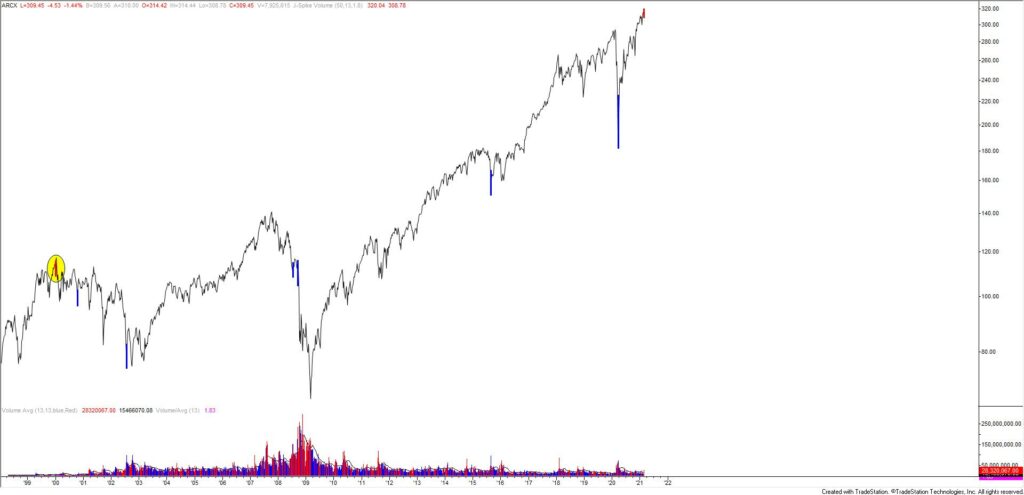
FXC (CANADIAN DOLLAR ETF) WEEKLY

USDCAD DAILY
EURO FUTURES HOURLY
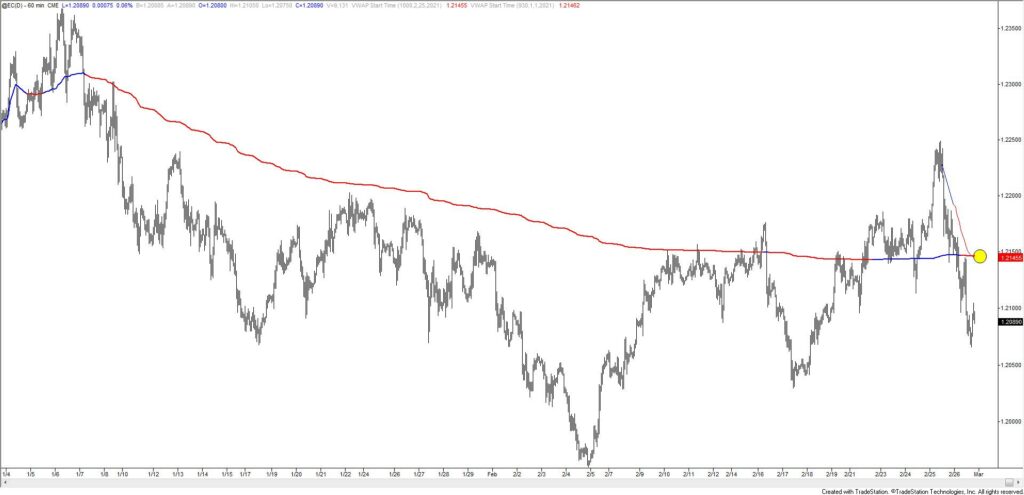
EURUSD is testing the noted 1.2080 level. In the event of a bounce, proposed resistance is 1.2140s. This level is defined by 2021 VWAP and VWAP from last week’s high.
2/25 – EURUSD spiked into and reversed from the noted 1.2220. My view is that a 3 wave rally is complete from the February low and that either a 3 or 5 wave decline will draw price beneath the February low in order to complete the larger correction from the January high. Short term channel support for a bounce is about 1.2080.
GBPUSD 4 HOUR

GBPUSD downside focus remains 1.3730 or so. Resistance now should be the underside of former February trendline support. That line is about 1.4050.
2/25 – GBPUSD has reversed sharply lower from the center line of the channel from the March low. Wednesday’s low is now proposed resistance at 1.4082. Downside focus is the lower parallel of the noted channel, which intersects the line that crosses highs since March 2019. That intersection is about 1.3730.