Market Update 5/17 – Levels to Know in DXY and QQQ

Market Update 5/16 – Weekly Bond Market Reversal
May 17, 2022
Market Update 5/19 – Impulsive Action in Commodity FX
May 19, 2022

QQQ DAILY
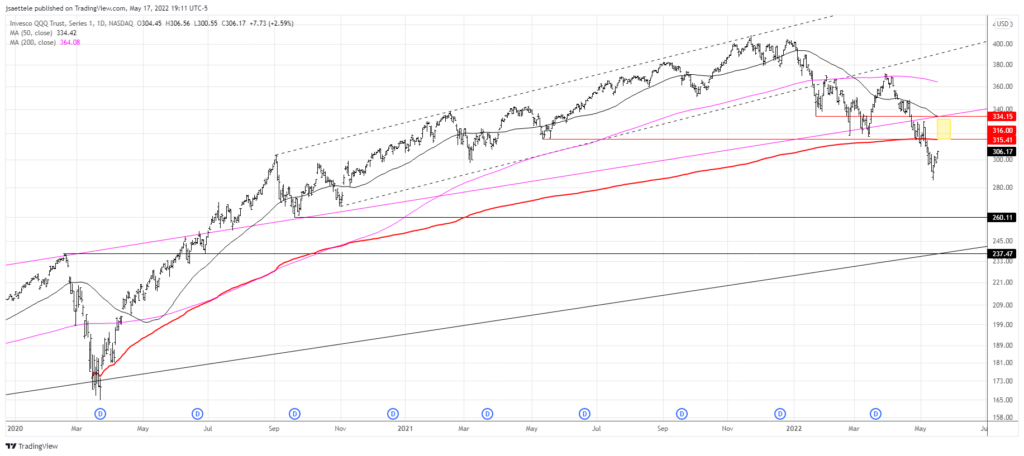
NQ (Nasdaq futures) had 2 closes under 12207 before turning up. I’m sharing QQQ today because levels above are clear. 315.40-334.15 is ‘the zone’ for resistance. The bottom of the zone is VWAP from the 2020 low, which should elicit an initial reaction lower. 295.75 is support now and I favor range trading between there and the proposed resistance zone.
4/26 – NQ has definitively broken the long term ‘pivot trendline’ (see zoomed out chart below). The next spot of interest is 12207 but it’s best to work in general information at the moment. That is, the trend is lower (price rejected by the 200 day average at the end of March and we’ve got lower lows and lower highs). There will be violent short squeeze rallies…maybe one from near 12207. The goal should be to identify the end of those rallies to short.
DIA DAILY
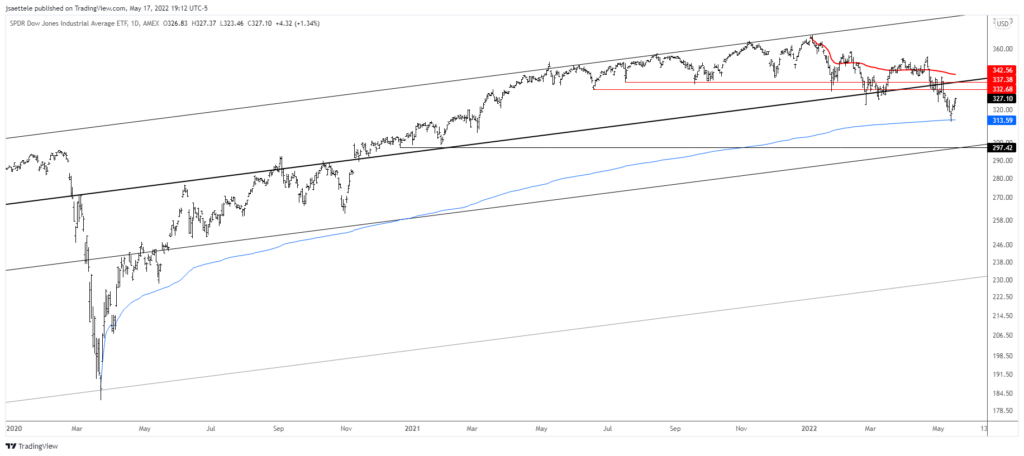
The DIA resistance zone is refined to 333/37. The zone is clearly defined by former support over the last 11 months (WELL defined former support often provides resistance and vice versa). I do expect back and fill action for so pay attention to 319 for support.
5/12 – DIA (Dow ETF) low today was 312.53, $1 below VWAP from the March 2020 low. Like BTCUSD (and ‘risk’ in general), today’s low is the line in the sand for a pivot. In other words, this is THE spot for a short covering rally. Keep in mind that all rallies begin as short covering rallies but in the current environment that term is appropriate (you’ll hear it a lot in the coming weeks/months). 322/24 and 333 are levels to know for resistance. I am of the mind that we test 297.50 but a rally now and then a drop to that level ‘makes sense’ from my vantage point.
DXY DAILY
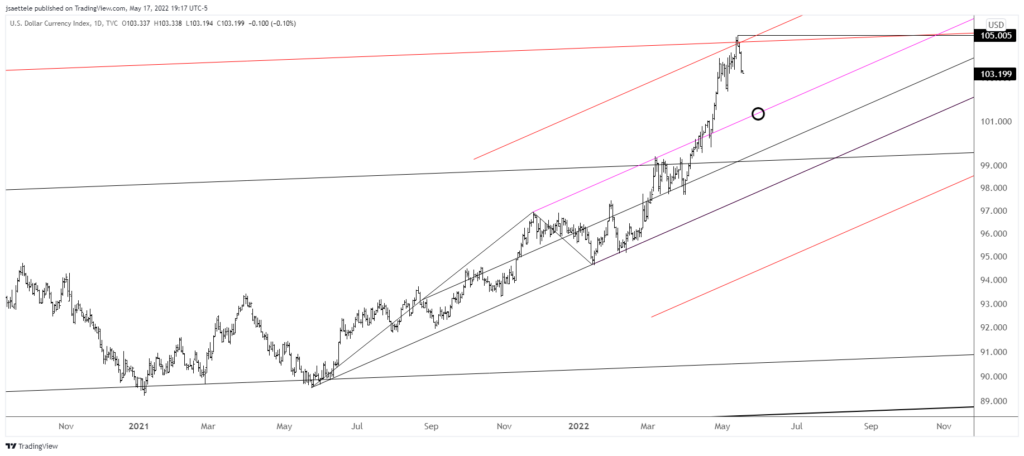
DXY topped RIGHT at the parallel that has been highlighted for weeks. Also, the full extension of the channel from the May 2021 low is on the high. The upper parallel (magenta line) from that channel is now proposed support near 101.20/30 over the next week. 103.90-104.20 is proposed support.
5/9 – This WSJ from Sunday features a’USD fist’ lifting weights. If this were a magazine cover, then it would be a reliable sign of a top. As a newspaper article, this is a sign at a lesser degree. Even so, it’s indicative of extreme sentiment and price is at a level that’s been key for decades. The chart below highlights the level just above 104, which was the 2017 high and July 2002 low. The USD may have higher to go over the long term but markets don’t typically clear such a massive level on the first attempt.
Do you make a profit trading DXY?
Try our funded trader program and get up to $1,000,000 in funding.
Learn more
