Market Update: January 10
BITCOIN BUBBLE
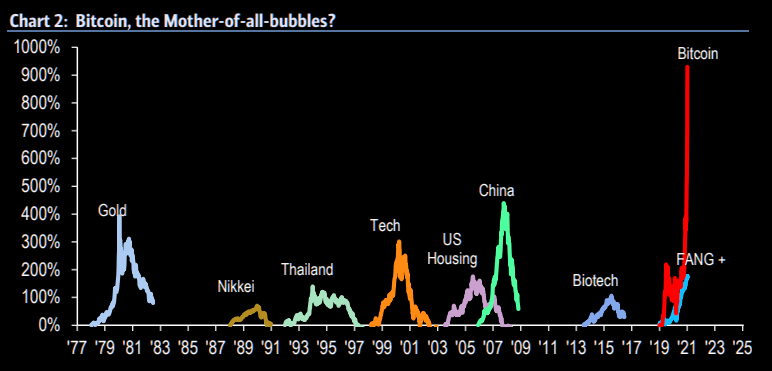
The Bitcoin rally dwarfs all other ‘bubbles’ in recent financial history (since the end of Bretton Woods). This can’t end well.
PPLT WEEKLY
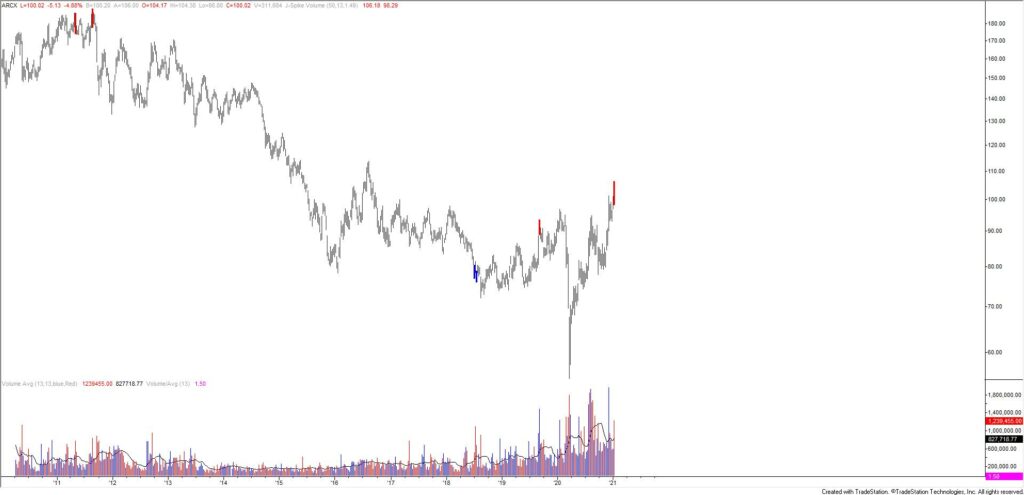
PPLT (platinum ETF) made a weekly volume reversal last week. Reversals in 2011 and 2012 identified peaks within the double top that led to a prolonged bear market. A reversal in 2019 was a minor high. PPLT (along with everything) has had quite a run since the March low and a decent sized counter trend move here ‘makes sense’.
EURUSD 4 HOUR
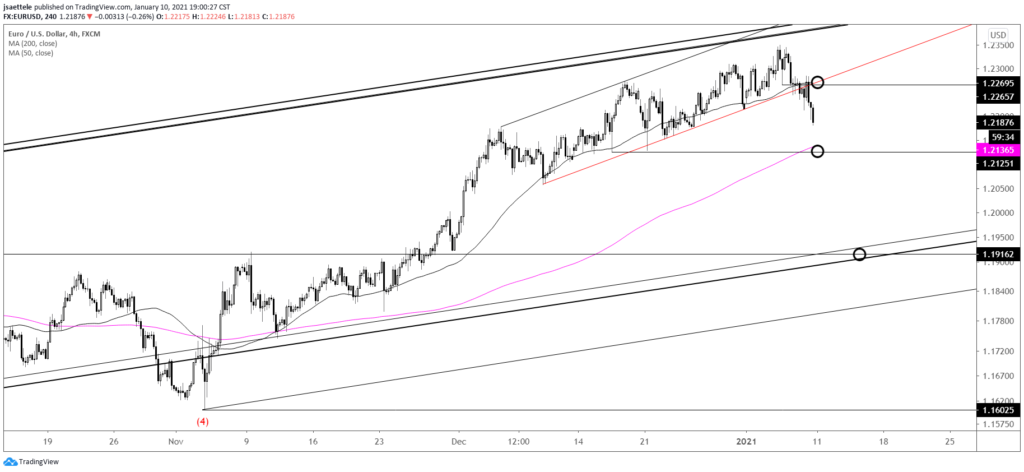
EURUSD is breaking down and focus is on 1.1915 or so. The underside of the just broken trendline near 1.2270 is now proposed resistance. 1.2125 is a possible bounce level.
1/6 – The only thing to update for EURUSD is the breakdown level, which is now about 1.2260. This is also a good time to highlight an example of ‘daily reversal resistance’. Daily reversal resistance is the close of the high bar of the previous move. In this case, that’s the 2/16/2018 close, which is 1.2408 (also the 4/18/2018 high…see below). If reached, that level is proposed resistance. So, I’m looking to either short under 1.2260 or near 1.2400.
USDJPY HOURLY
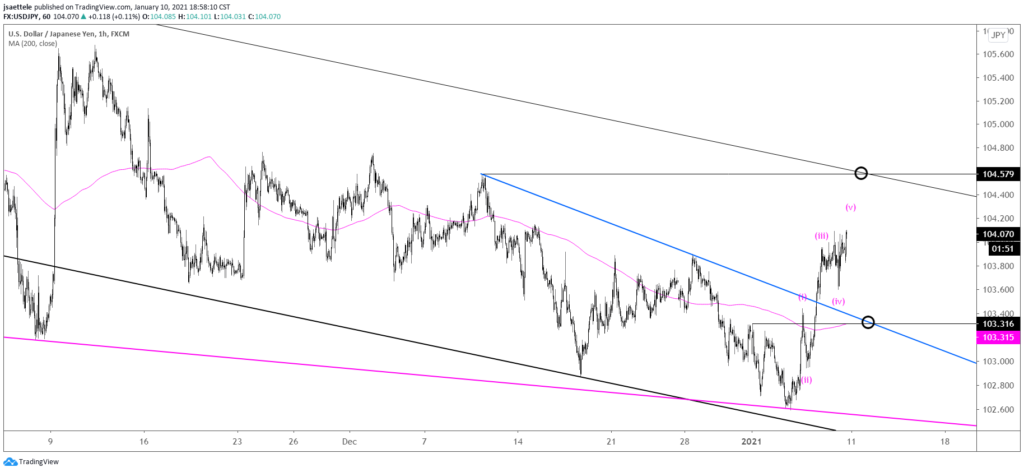
The USDJPY rally is now in 5 waves so be on guard for a corrective pullback. The top side of the blue trendline remains proposed support. That line is now about 103.32. Bottom line, I favor buying dips.
1/7 – USDJPY has turned sharply higher this week and will likely made a weekly J-Spike. If volume is sufficient tomorrow, then a weekly volume reversal is possible as well. I like that price turned up from the line that connects the July and November lows. 104.00 is viewed as a reaction level and proposed support is now 103.40s. The big test for bulls is the upper parallel of the channel from the March high at 104.50s.
NZDUSD HOURLY
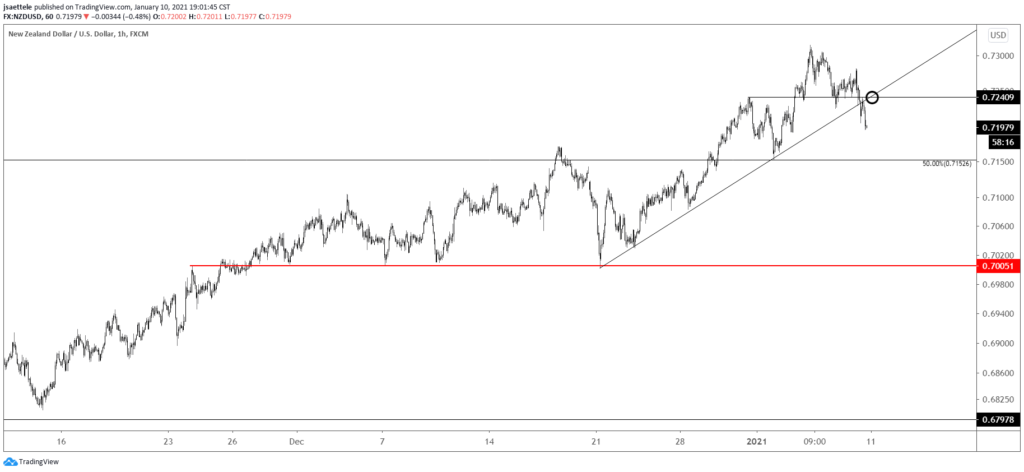
NZDUSD has broken a short term trendline, which is the trigger for a short following the turn lower from .7315. The underside of the trendline is now proposed resistance near .7240. .7150 is a possible bounce level but the more important downside level of interest (for now at least) is .7000.
1/5 – Mid-.7200s has been a huge pivot for NZDUSD several times in its history. Notably, the 1988 and 1996 highs are near the spot price. Major turns occurred here in 2011 and 2015 as well. The chart below shows the percentage that price deviates from the 200 day average. Over the last several decades, a 10.4% reading above the 200 day average is rare. In 2009, the price remained above this threshold for an extended period of time but the initial reading led to a 3 figure sell-off. By this measure of momentum, bulls are flirting with danger.
USDTRY DAILY
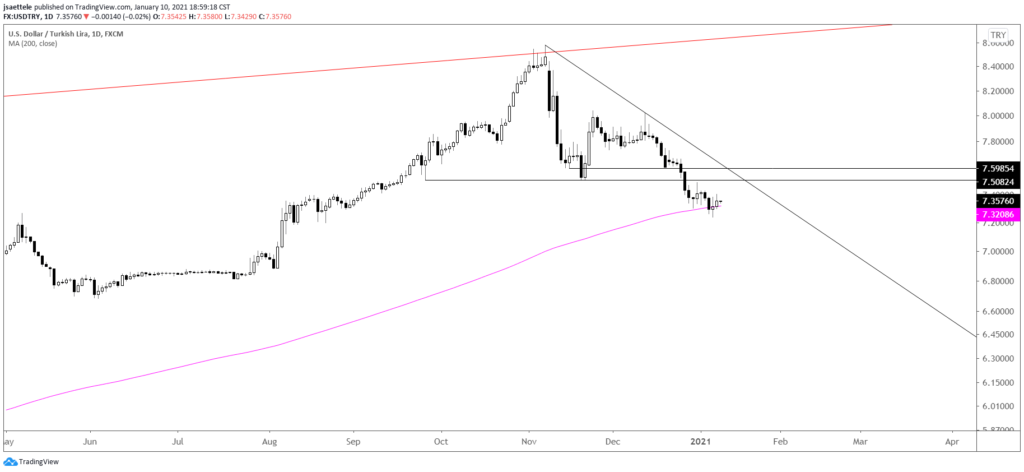
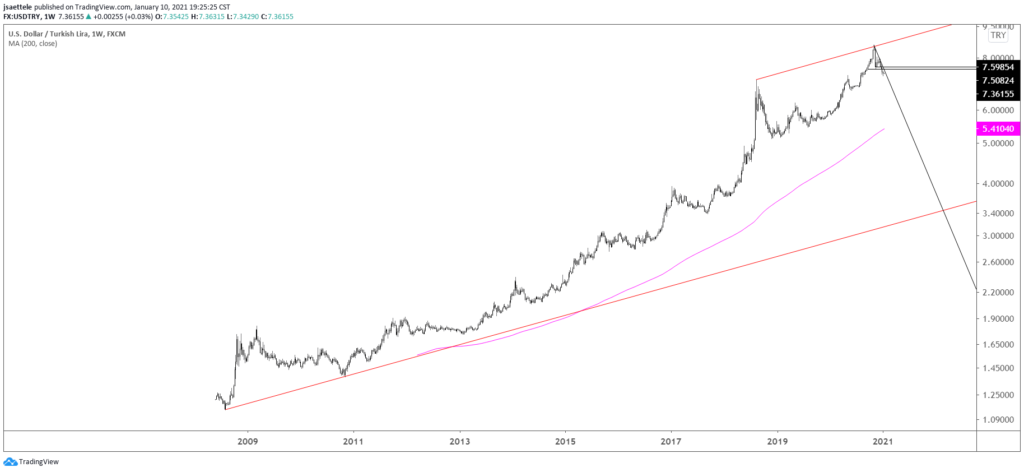
USDTRY has turned up from the 200 day average. While I am of the mind that the larger trend has turned down (see long term chart below), this is a good spot for a bounce. Keep an eye on 7.5080-7.5980 for possible resistance.
USDTRY WEEKLY
