Market Update: January 31
SPOT GOLD 4 HOUR
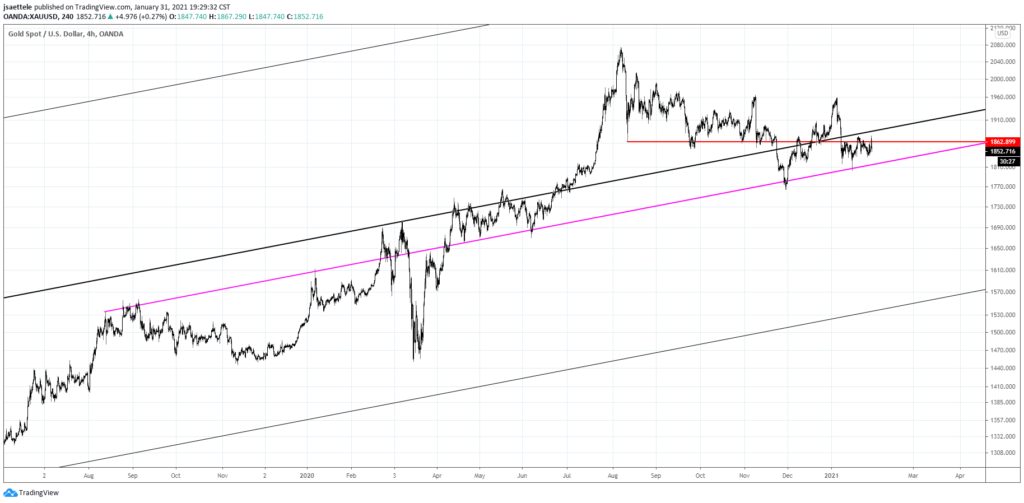
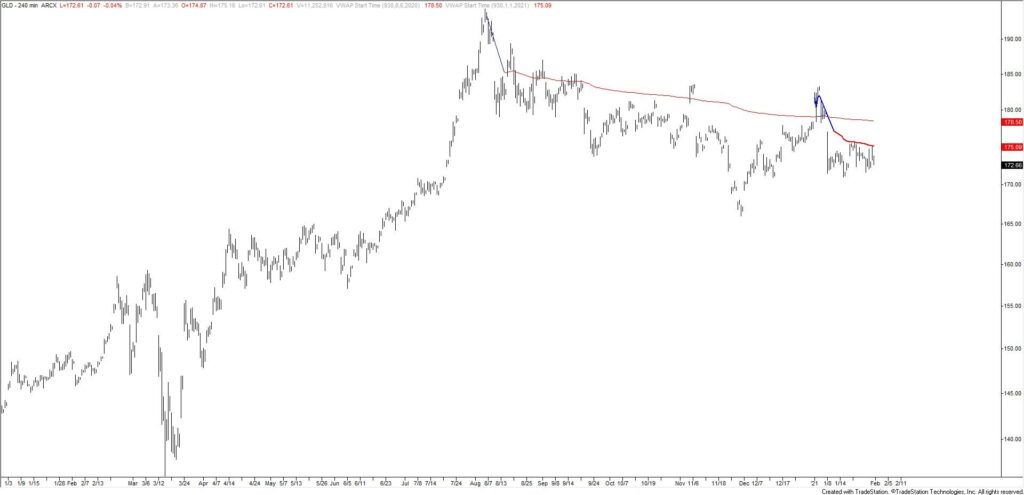
Gold has been churning sideways since the breakdown in early January and strength has been capped by the 8/12 low. If gold is going to break down, then I’d think that it’s from current levels since 2021 VWAP has been resistance for the last few weeks (see futures chart below).
GLD 4 HOUR
AUDUSD 4 HOUR
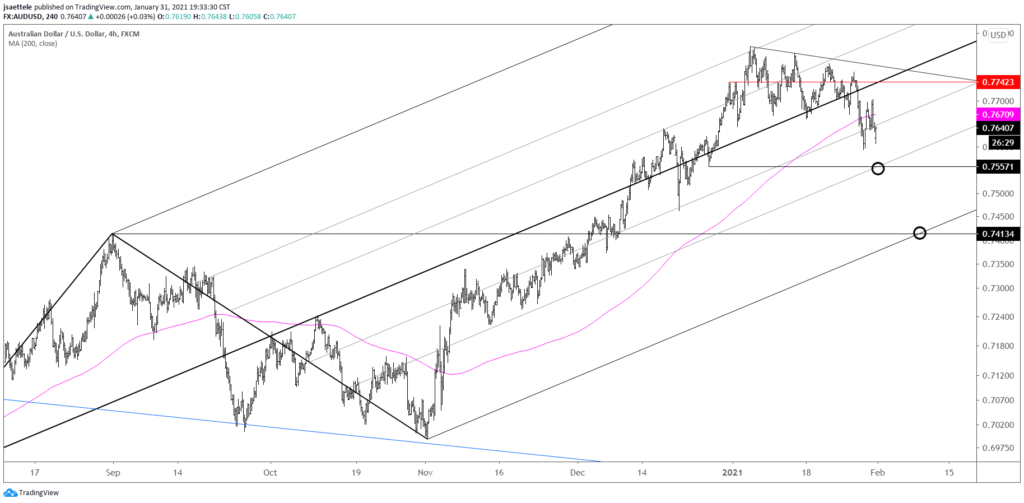
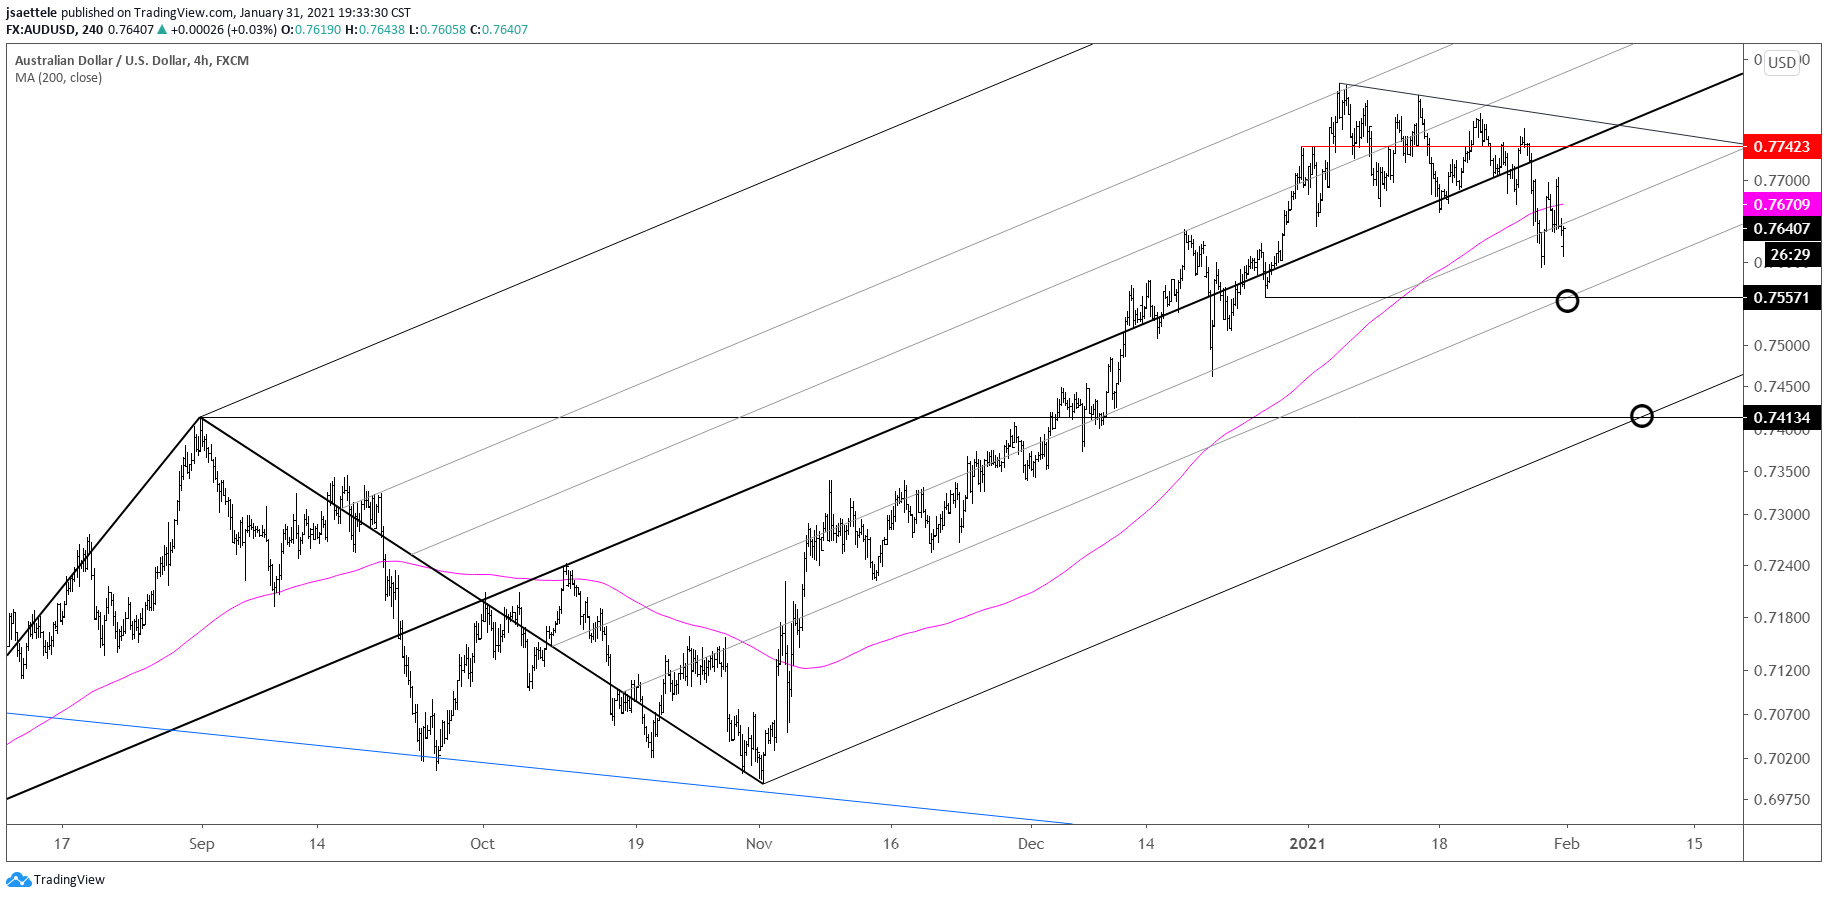
Near term AUDUSD focus remans .7550s and the lower parallel of the Schiff fork from the March low. This line crosses the September high at .7413 early next week. Risk on shorts is Friday’s high at .7704. Strength above there would face possible resistance from the median line again near .7740.
1/27 – Action since the AUDUSD high constitutes a running wedge. Price is testing the lower parallel from said wedge now and a break below would lead to accelerated weakness towards .7550s and then the September high at .7413. If price does break below the wedge line (magenta line), then the underside of the wedge line becomes resistance and I’d look to add to shorts on a re-test of that line from below.
USDCAD 4 HOUR
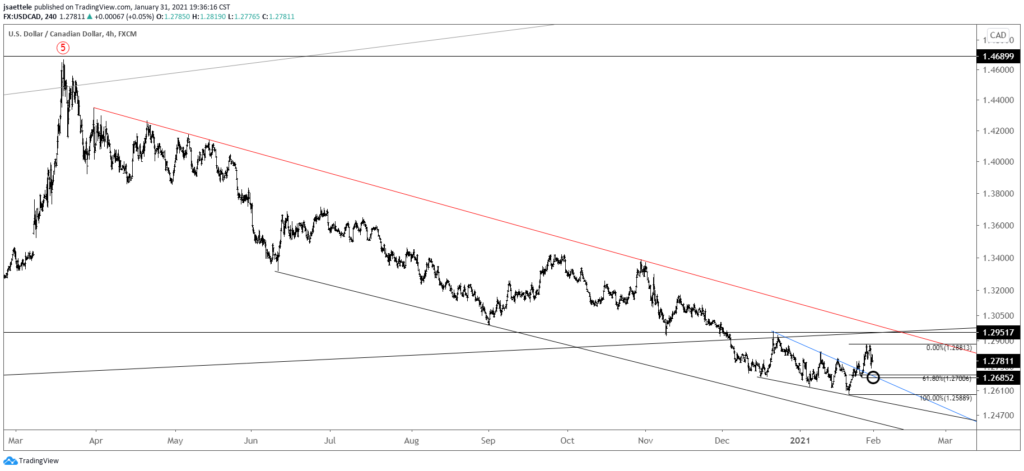
There is no change to the near term USDCAD outlook. Focus remains on 1.2950 and the top side of former trendline resistance (blue line) remains proposed support. That line is near the 61.8% retrace of the rally from the low at 1.2700.
1/27 – USDCAD has broken higher from a short term wedge (Elliott traders would call this an ending diagonal). Immediate focus is the origin of the wedge at 1.2950. The top side of the former wedge line (blue line) is now support for longs near 1.2715.
USDJPY DAILY
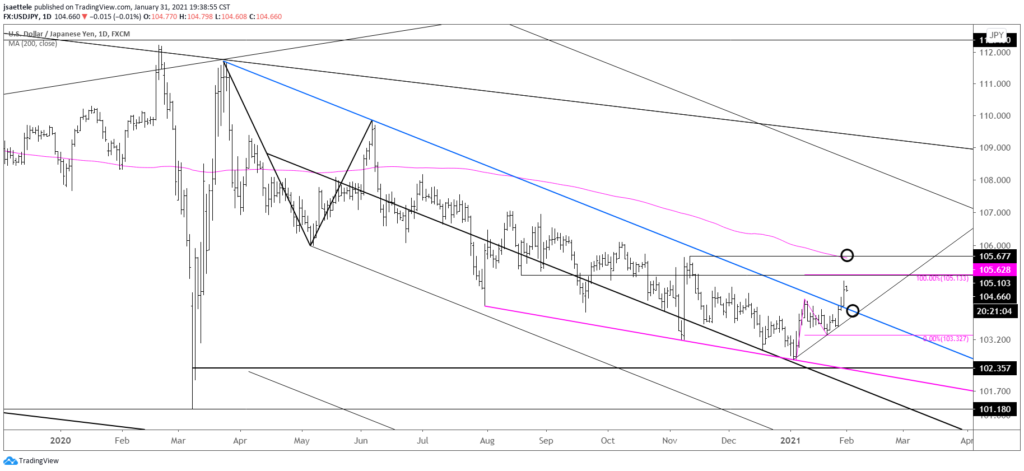
USDJPY focus remains on 105.13 and 105.60. 105.13 is where the rally from the low would consist of 2 equal legs. 105.60s is the 200 day average and November high. The top side of the line from the March high should provide support if reached. That line is about 104.10 now.
1/28 – We nailed the USDJPY entry and price has broken above the channel from the March high. The top side of the former channel resistance (blue line) is now proposed support near 104.10. There are 2 levels to keep in mind on the upside in the near term; 105.13 and 105.60s.

