Market Update 3/4 – S&P Testing Wedge Barrier
S&P 500 FUTURES (ES) DAILY
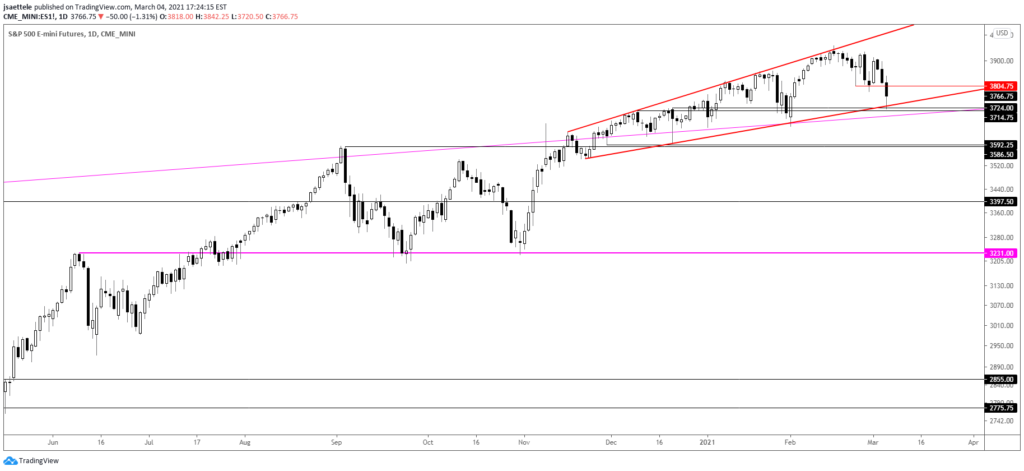
ES tagged the wedge support and bounced today. This is the line in the sand. If the wedge breaks then I’ll discuss measuring techniques but the clear level below looks like 3590ish. If this is going to break sooner than later then I’d expect 3805 or so resistance overnight. Seasonal tendencies are bearish through 3/19.
2/23 – S&Ps have turned down from expanding wedge resistance. The bottom of the wedge is 3715. Everything until then is ‘noise’ but keep 3910 in mind for possible resistance.
NASDAQ FUTURES (NQ) DAILY
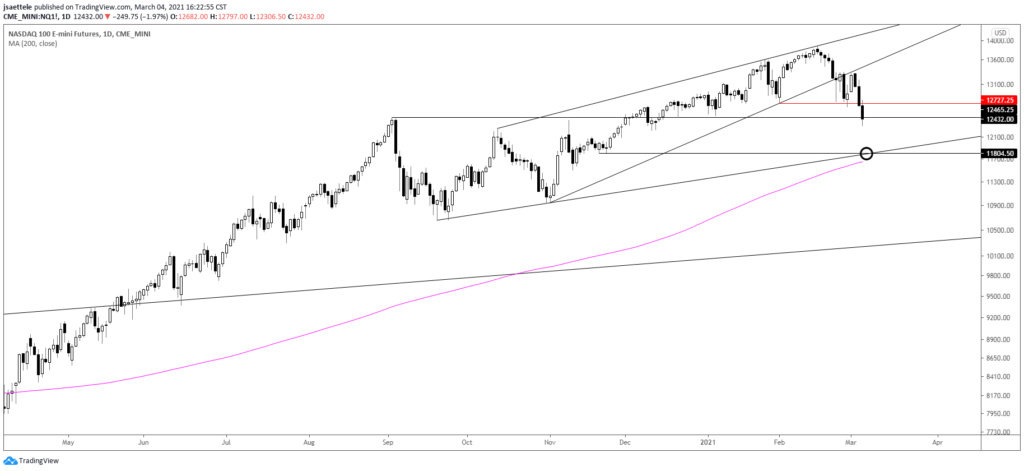
NQ tested the underside of the wedge line early this week and has dumped. Textbook. Some back and fill here is a possibility given the presence of former resistance from the August high but general focus remains lower until 11805. 12727 is now proposed resistance.
3/1 – NQ futures broke a well-defined wedge last week before bouncing sharply today. The underside of the wedge is about 13353. Watch that for resistance. If that fails to provide resistance, then former support at 13468-13516.75 (see below) is a zone to pay attention to.
COPPER DAILY
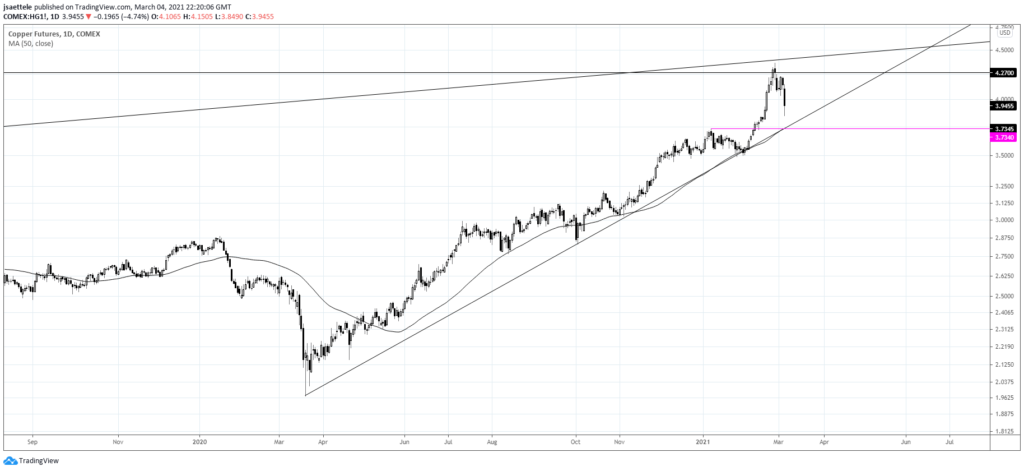
Pay attention to 3.7300s in copper. A drop below would break the uptrend from the March 2020 low, which would obviously indicate a significant behavior change and new environment for this extremely important market.
2/24 – Copper is another pure inflation trade asset. Price is closing in on the underside of the long term trendline (log scale) that was resistance in 2017 and 2018. Daily RSI is almost 88! Readings this high have occurred at or near price tops except for April 2006, when copper dropped for 2 weeks before going into a blowoff.
EURUSD DAILY
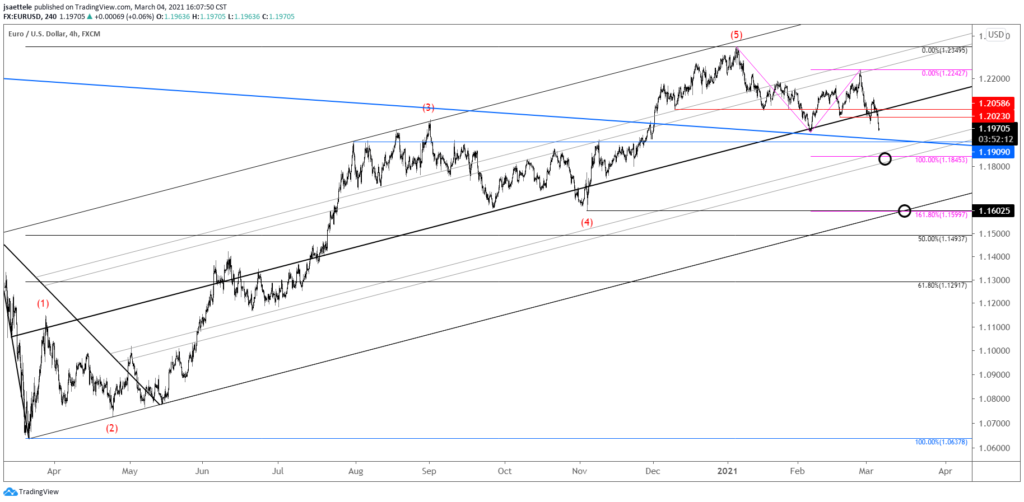
EURUSD broke below the center line of the channel from the March 2020 low and that center line is now proposed resistance if reached along with former support in the 1.2020/60 zone. The next 2 downside levels of interest are 1.1845 and 1.1600. The first level is 2 equal legs down from the high. The lower level is the 1.618 extension and the former 4th wave low (November low).
GBPUSD HOURLY
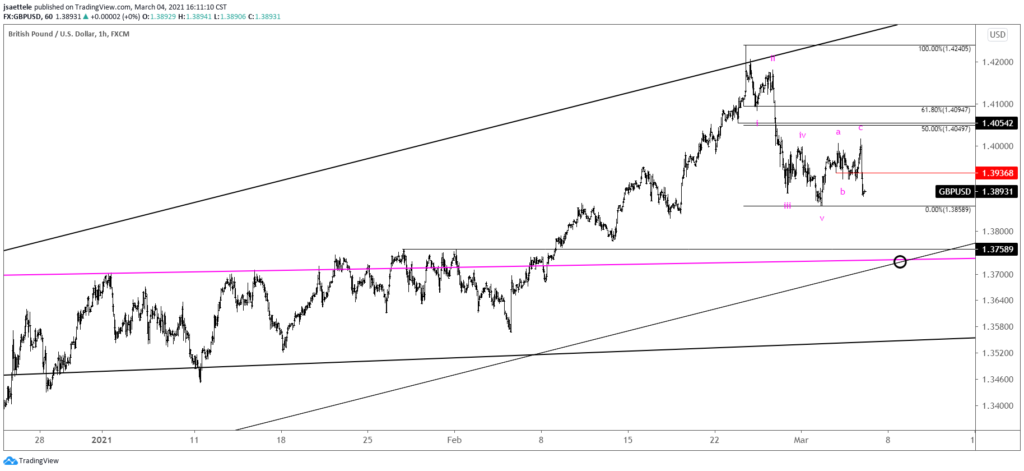
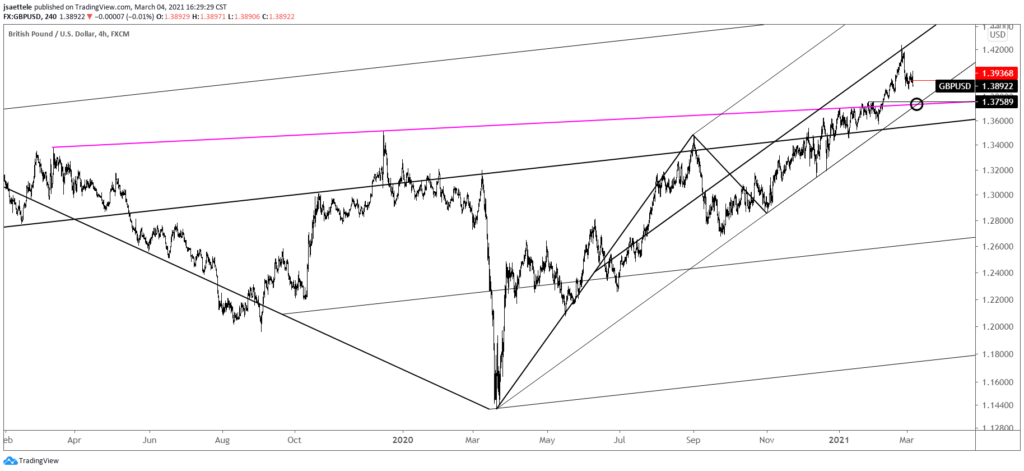
Cable completed its 3 wave correction today and turned sharply lower. Downside focus is still about 1.3730. That level is important to the integrity of the broader bull trend (see the daily chart below) so a break below would require a reassessment of the underlying trend. Proposed resistance is the week open price at 1.3936.
3/3 – GBPUSD continues to follow the script. Today’s dip is viewed as small wave B. Therefore, one more push higher (wave C) to complete the 3 wave correction is in order before another leg lower into the low 1.3700s. Proposed resistance remains 1.4050-1.4100.
GBPUSD DAILY
AUDUSD WEEKLY
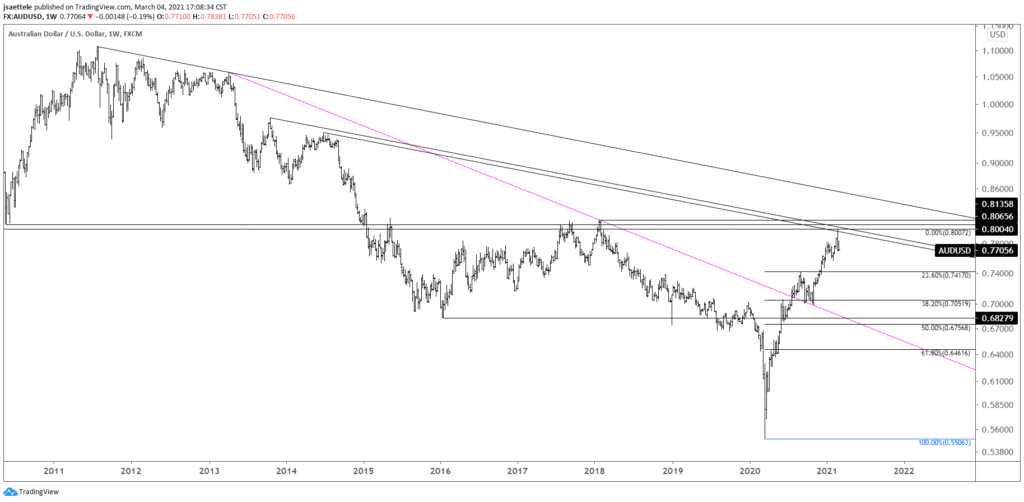
AUDUSD has turned down from well-defined long term resistance (remember the weekly volume reversal last week!). Initial downside focus is the September high at .7414, which is also the 23.6% retrace of the rally from the March 2020 low. Proposed resistance is former support at .7735.
NZDUSD DAILY
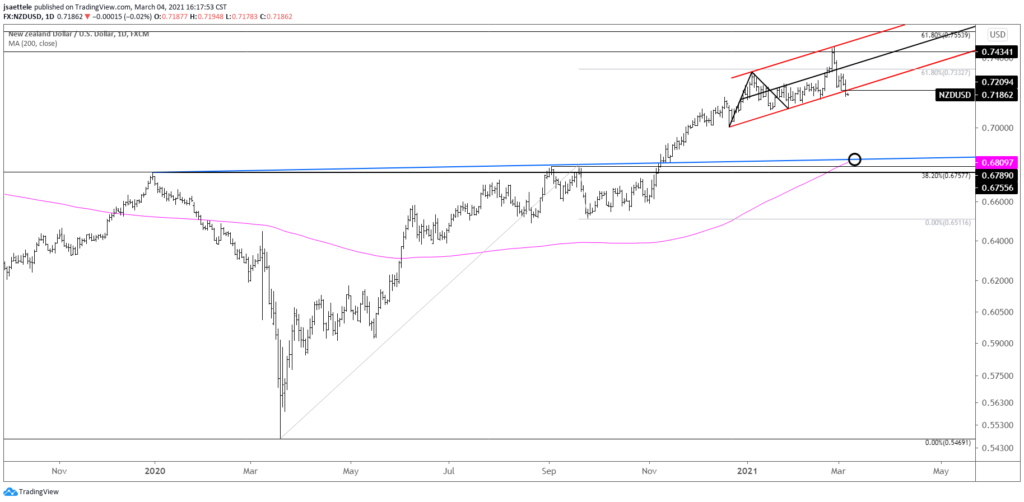
NZDUSD broke the 2+ month channel today so focus is lower…period. The underside of the channel should provide resistance now near .7200. Former lows at .7097 and .7003 are possible bounce levels but broad downside focus is the noted .6800.
3/3 – .7367 could still come into play for NZDUSD resistance but all eyes are on the lower channel line that originates at the 12/21 low. A break below there (basically .7200) would warrant a breakdown entry with downside focus near .6800 (200 day average and neckline…in blue…sFormer lowee daily chart below).


