Market Update 3/3 – Honing in on USD Long Entries
USDOLLAR HOURLY
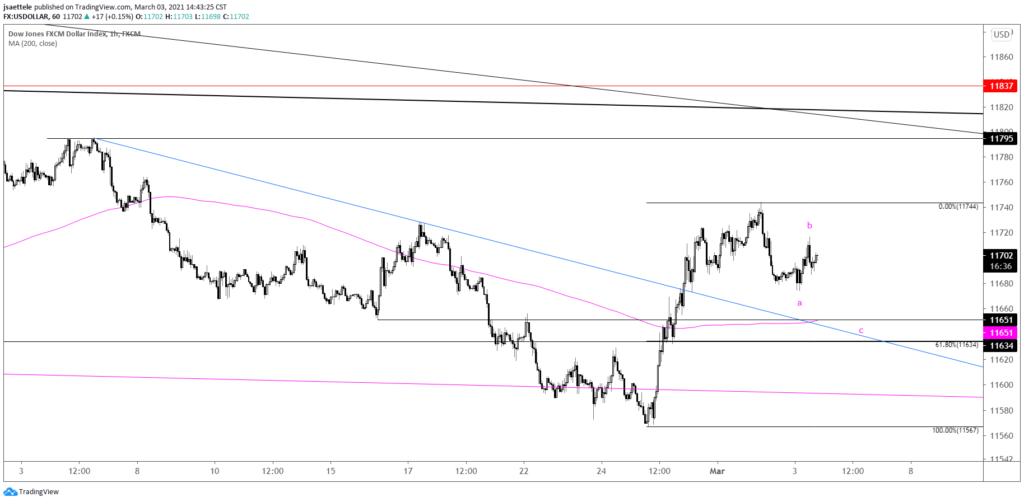
A well-defined base has formed in USDOLLAR since mid-February. Zooming into price action since the 2/25 low reveals an impulsive advance followed by a drop and today’s bounce. I’m of the mind that the drop and bounce compose waves A and B of a 3 wave pullback. Ideal support for the end of the pullback is 11634/51.
EURUSD HOURLY
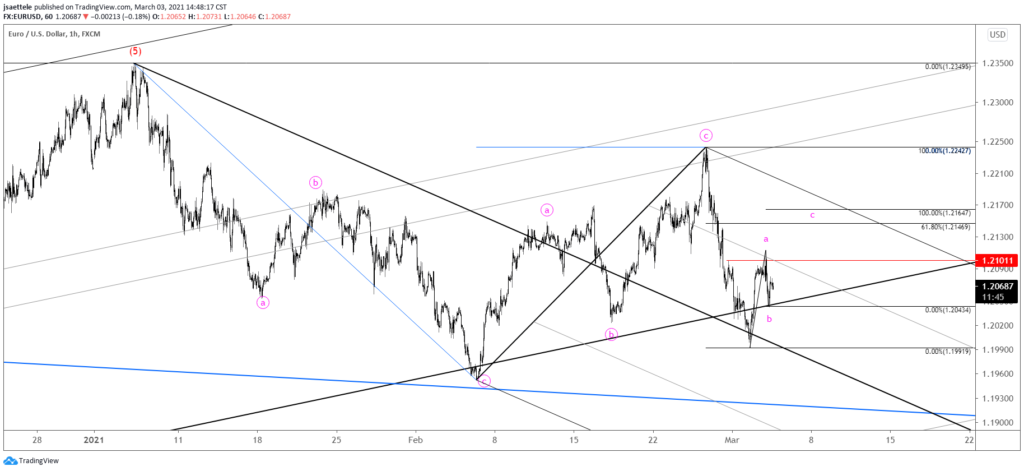
EURUSD spiked into 1.2100 and turned down but I’ve got to respect the potential for one more push higher in order to complete 3 waves up from Tuesday’s low. Under this scenario, the zone for resistance is 1.2147/65 (61.8% retrace and 2 equal legs up from the low).
3/1 – EURUSD is right back on the center line of the channel from the March low. This was support in early February. I am expecting a break this time but maybe not before a bounce into 1.2090-1.2100. This level is defined by the underside of the line off of the 2/5 and 2/17 lows. There are several VWAPs there as well (not shown today). A possible downside target is where the decline from the January high would consist of 2 equal legs; at 1.1845.
GBPUSD HOURLY
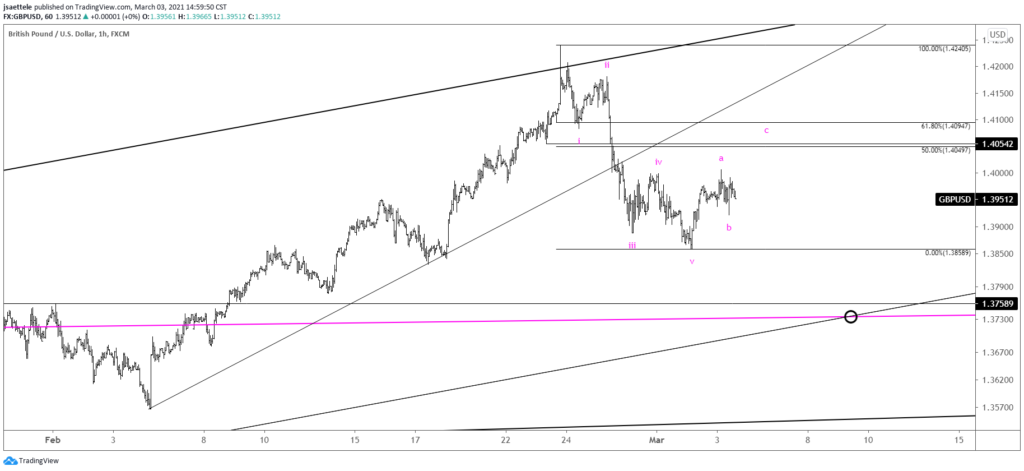
GBPUSD continues to follow the script. Today’s dip is viewed as small wave B. Therefore, one more push higher (wave C) to complete the 3 wave correction is in order before another leg lower into the low 1.3700s. Proposed resistance remains 1.4050-1.4100.
3/2 – GBPUSD completed its 5 wave drop today and focus is on identifying the end of a 3 wave corrective bounce. The ideal zone for the corrective top is 1.4050-1.4100. A small pullback followed by a rally into that zone is what I’m looking for.
USDJPY DAILY
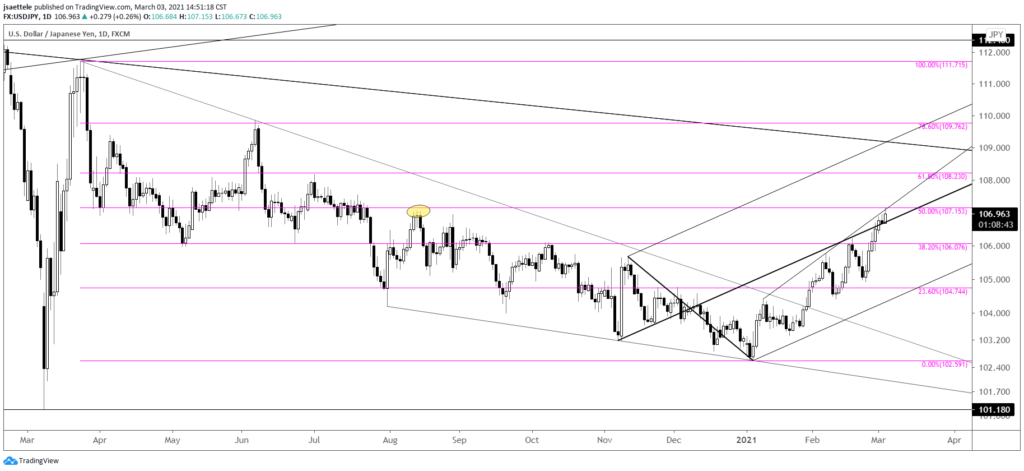
USDJPY is testing an important level. The 50% retrace of the decline from the March 2020 high, August 2020 high, and line that crosses tops since January are at the current level. There is no reason to fade strength here yet but the combination of bullish USD patterns in other crosses and an important level in USDJPY make short Yen crosses intriguing. If the small C waves in other USD crosses play out as suspected then I’ll dive into Yen crosses for opportunities (AUDJPY is a favorite by the way….we looked at that last week).
USDCAD 4 HOUR
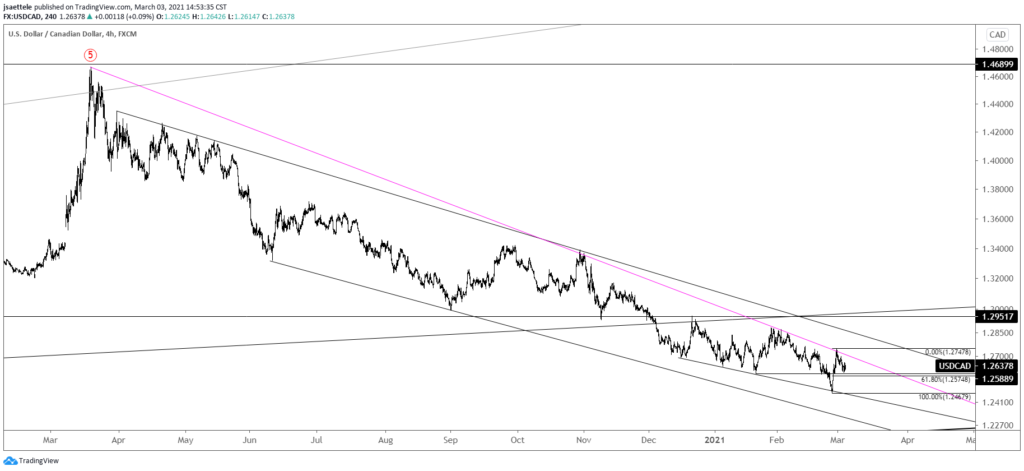
USDCAD tested the trendline from the March 2020 high yet again last week. A break above would indicate an important behavior change (bullish). Until then, keep the 61.8% retrace of the rally from the low in mind for support at 1.2575.
2/28 – CAD futures made a weekly volume reversal last week. The only other weekly volume reversal at least a one year high with 1.5 x the 13 week average of volume occurred at the January 2016 low. FXC (ETF) has seen a number of weekly volume reversals. Most of those reversals did identify important turns. That chart is below. For USDCAD, price is testing the 50 day average and trendline from the March high. A break above would be important. Until that happens, watch for support near 1.2600.
NZDUSD 4 HOUR
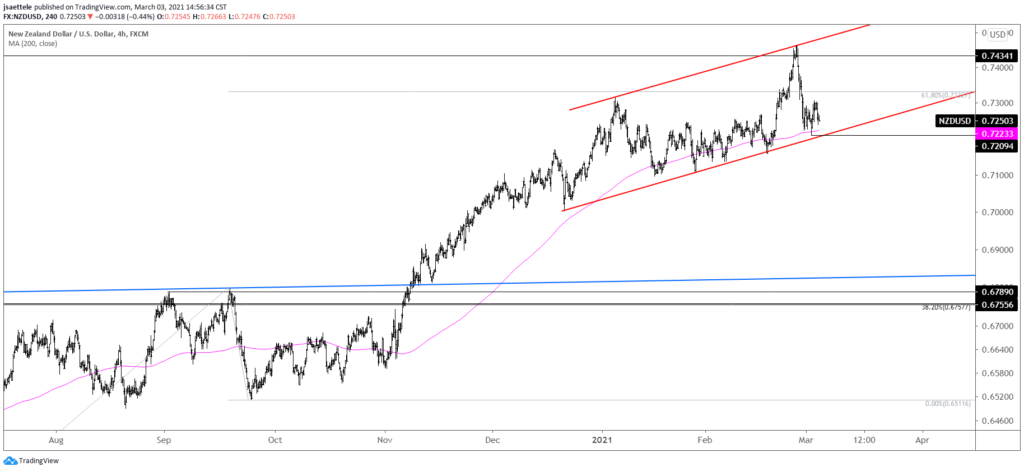
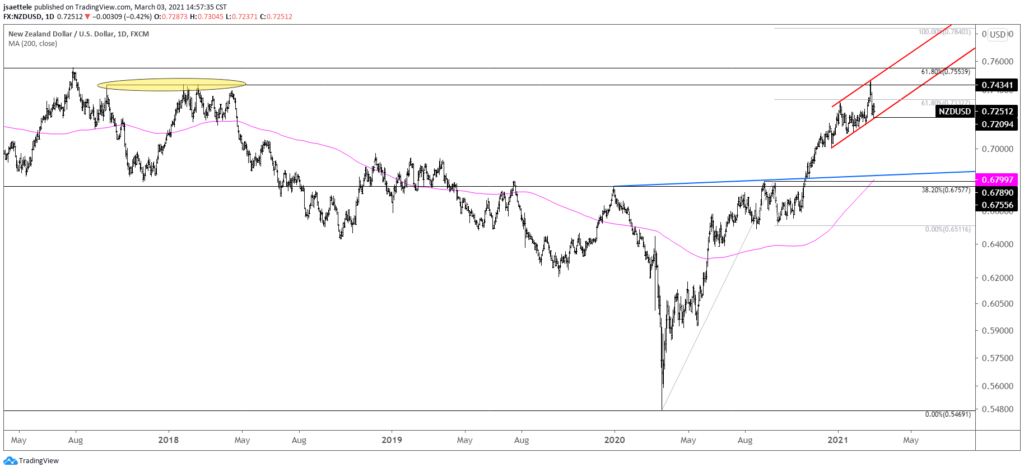
.7367 could still come into play for NZDUSD resistance but all eyes are on the lower channel line that originates at the 12/21 low. A break below there (basically .7200) would warrant a breakdown entry with downside focus near .6800 (200 day average and neckline…in blue…see daily chart below).
3/2 – Watch for NZDUSD resistance near the 61.8% retrace of the drop at .7367. This is also the median line of the Schiff fork from the March 2020 low (the median line is also in line for AUDUSD resistance). Ultimately, a downside level of interest in Kiwi is .7100.
NZDUSD DAILY