Market Update 3/21 – Stocks into Resistance
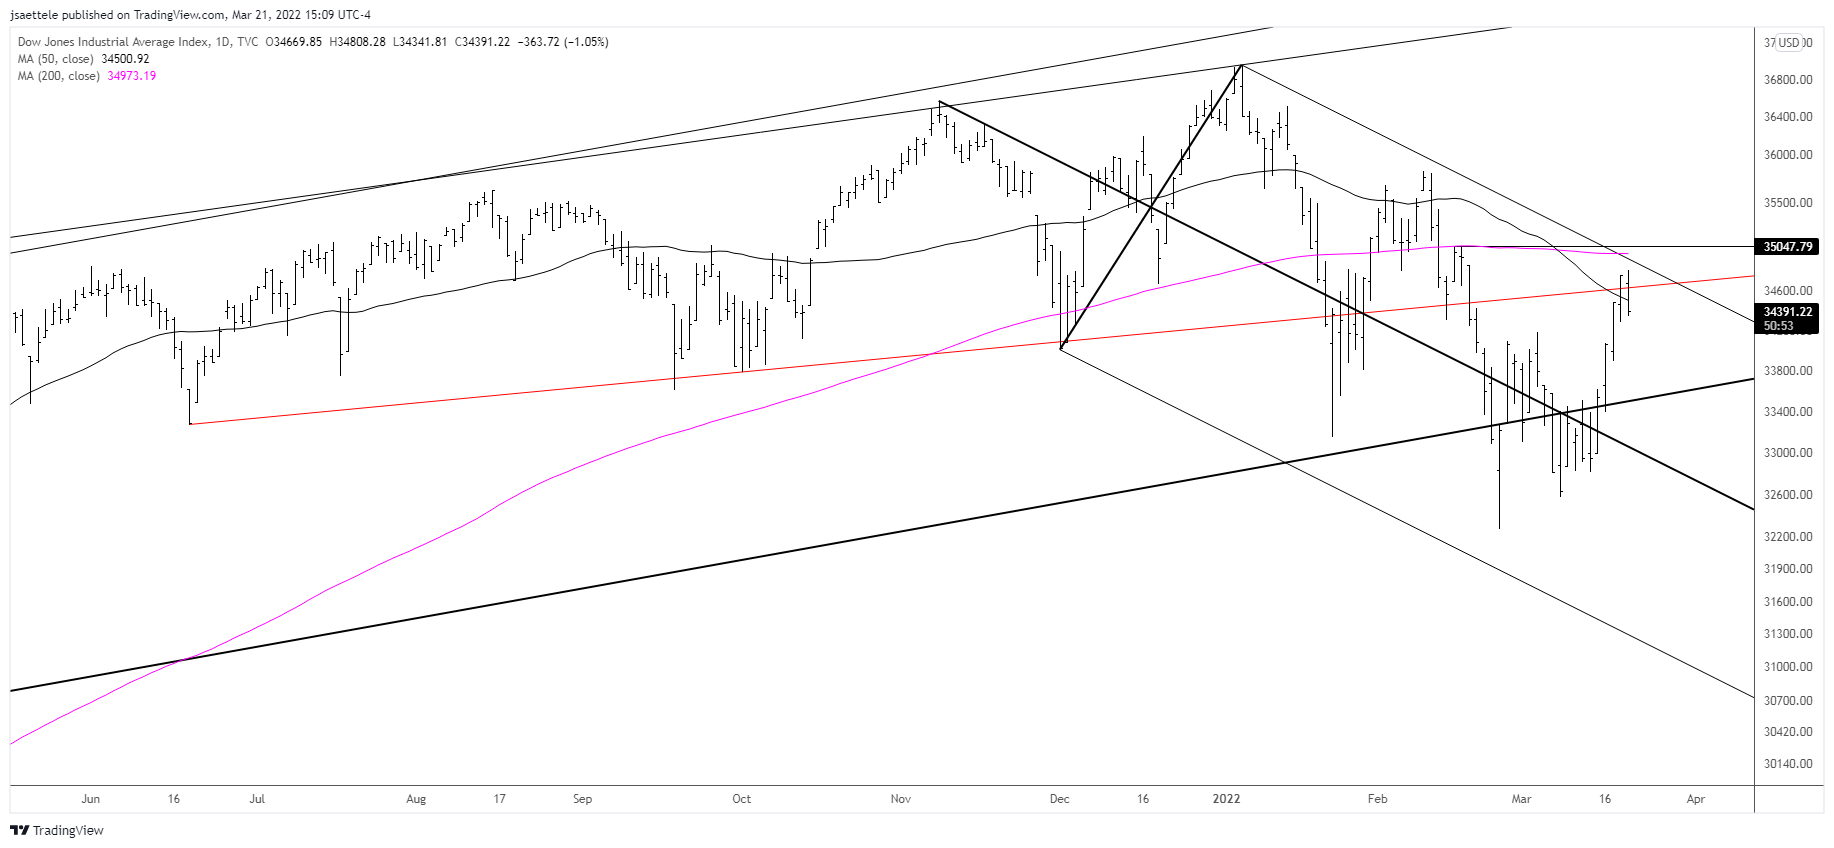
DJIA DAILY
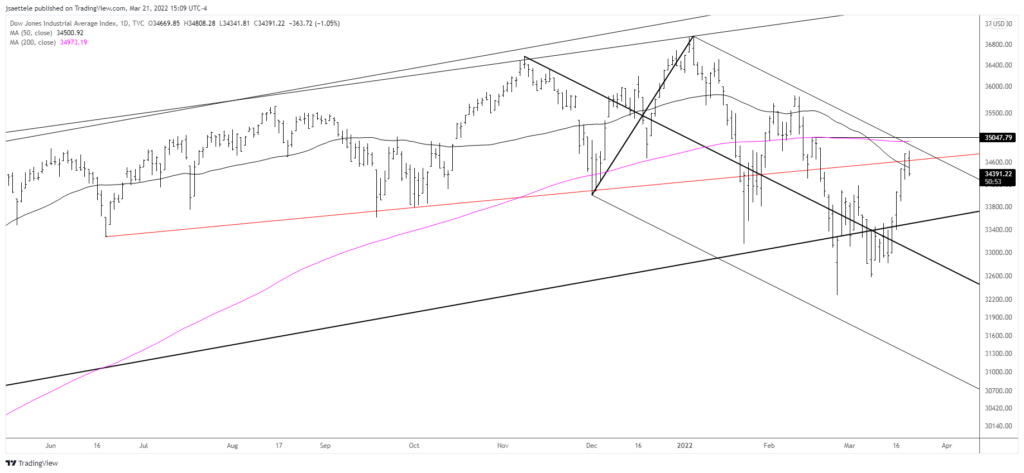
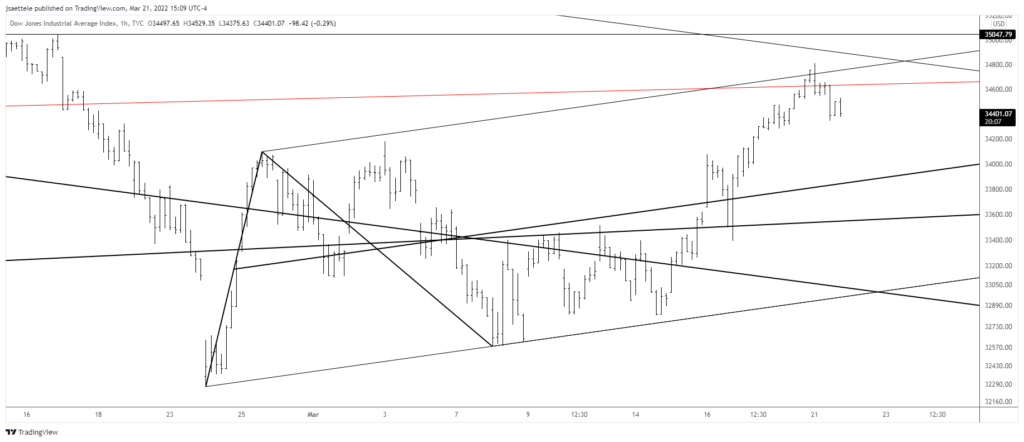
The Dow has reached and responded to the noted level for resistance. The rally from 2/24 also channels in a corrective manner (see hourly chart below). I’m ‘thinking’ lower from this level with possible support near the center line of the corrective channel (about 33860).
3/16 – Heads up for 34665 or so in the Dow. This is the 12/20 low, 50 day average, and underside of former trendline support (red line). In fact, a tag of this line would be nothing more than a re-test of the expanding wedge.
DJIA HOURLY
CRUDE OIL 4 HOUR
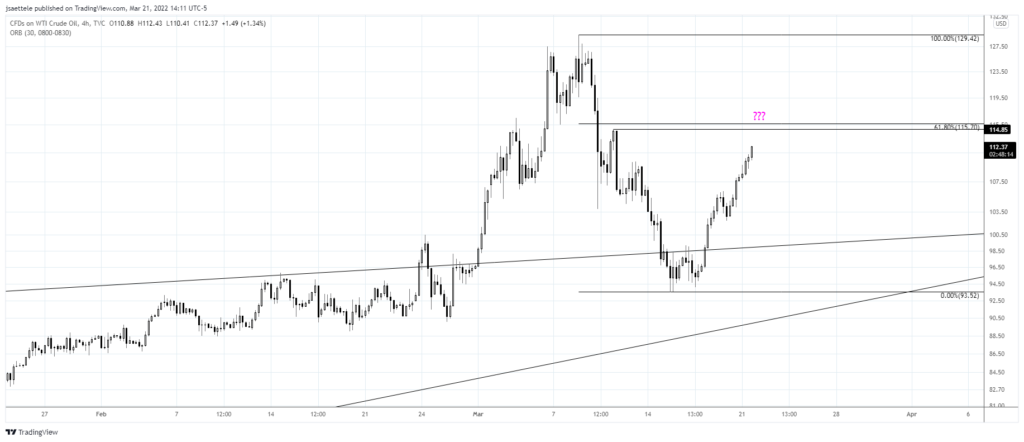
After plummeting under $100, crude is nearing the 61.8% retrace of the decline at 115.70. There are also several highs/lows near this price from early in the month. My view remains that we saw a massive blow-off top so watch for resistance and a lower high.
3/14 – Crude has dumped about $30 from the high…which was made 4 days ago! How about for that a blowoff top?! Price is nearing possible support from the top side of the line that crosses highs since March 2021. That line is about 98.20.
Do you make a profit trading Crude Oil?
Try our funded trader program and get up to $1,000,000 in funding.
Learn more
GBPUSD WEEKLY
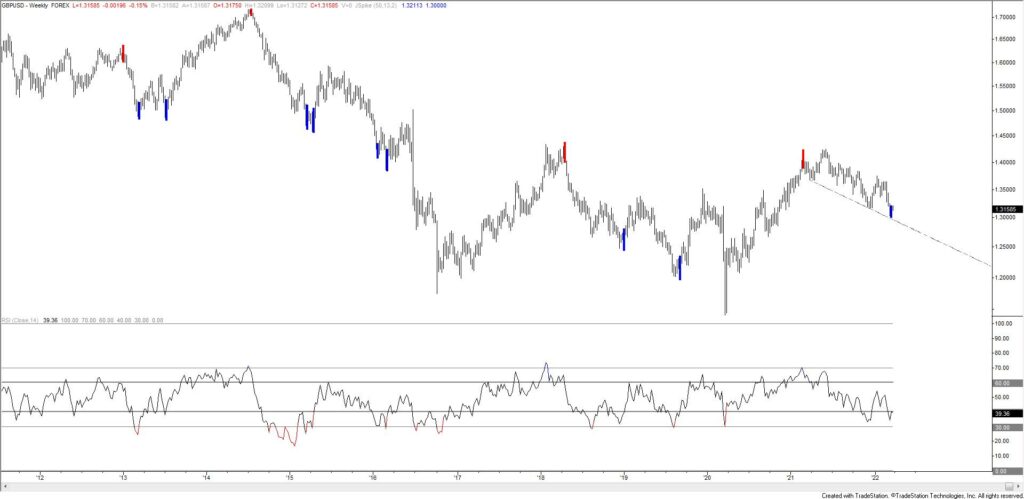
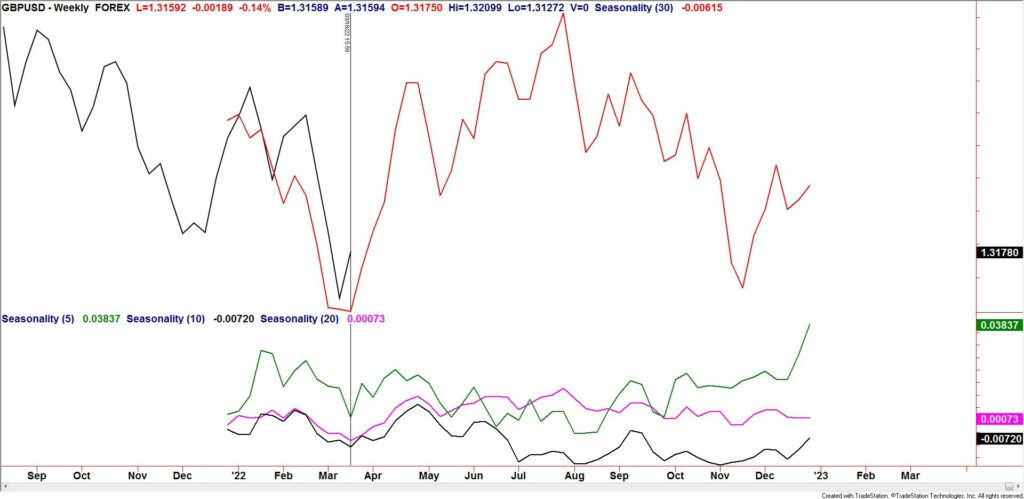
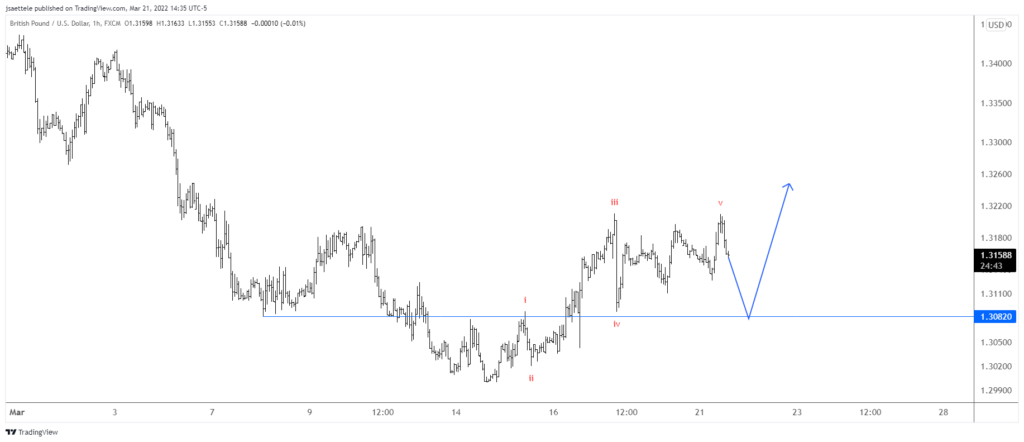
GBPUSD made a weekly reversal last week. Signals for the last 10 years are shown on the chart and most (almost all) of the signals indicated important turns. Also, seasonal tendencies are now bullish (see below). Near term (2 charts down), the rally from the low consists of 5 waves with wave 5 as an ending diagonal. The implication is that GBPUSD pulls back to 1.3080/90 before surging higher in a 3rd or C wave within a larger bullish cycle from the low.
GBPUSD WEEKLY SEASONALITY
GBPUSD HOURLY
USDSEK DAILY
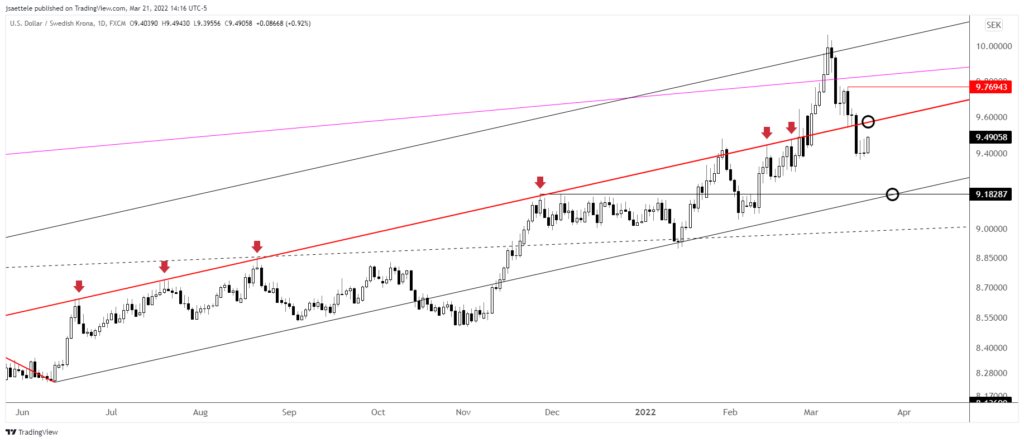
Pay attention to USDSEK, notably the underside of the median line, which has been precise resistance for nearly a year. The median line is now about 9.5650.
3/16 – USDSEK held up for 2 days before crashing though the median line today. The drop under the median line is a key bearish development for the USD generally. The underside of the line is now resistance…as it was in June, July, August, November, January, and February. That’s currently about 9.56. The next downside test is 9.15/18 (lower parallel and former resistance).
AUDUSD DAILY
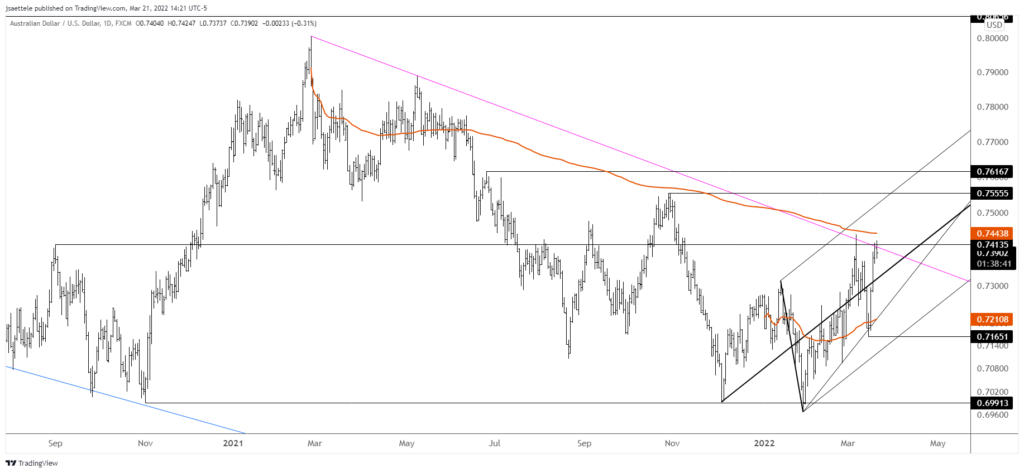
AUDUSD is testing noted trendline resistance. VWAP from the 2021 high is just above as well. In other words, this is a significant level so a break above would be…significant! Still, resistance is resistance until broken so respect downside at this juncture. The median line is possible support near .7320.
3/17 – AUDUSD is closing on key trendline resistance near .7410. I’ve been positive on Aussie for a while and remain so with proposed support now marked from the median line from the fork that originates at the December low. That line is about .7315.
USDCAD DAILY
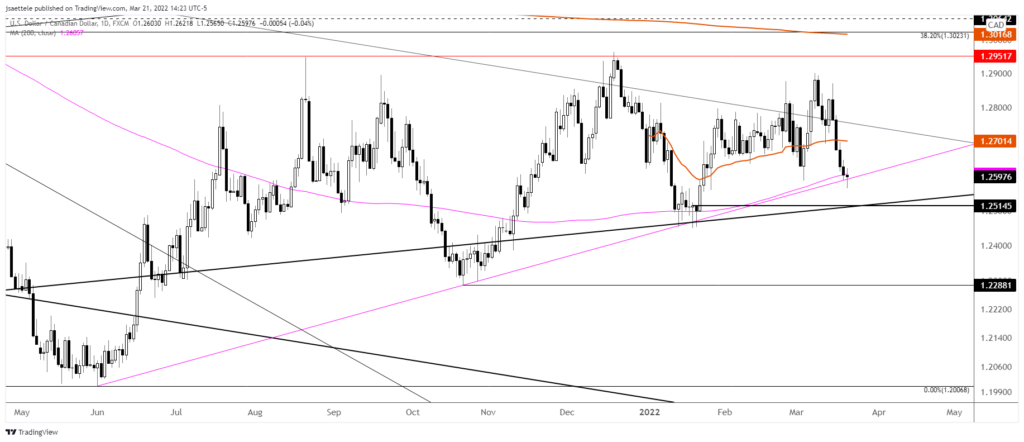
USDCAD has reached and responded to the trendline from the June 2021 low. This is also the 200 day average. I’m thinking higher in the near term with possible resistance near 1.2700 (3/11 low and 2022 VWAP).
3/17 – The USDCAD triangle as described previously is still valid but doesn’t make sense given the broader USD view. Still, pay attention to the trendline near 1.2587 for possible support. A break of that line would warrant a bearish stance although daily reversal support at 1.2515 should be noted.

