Market Update 3/29 – Short GBPUSD Setup
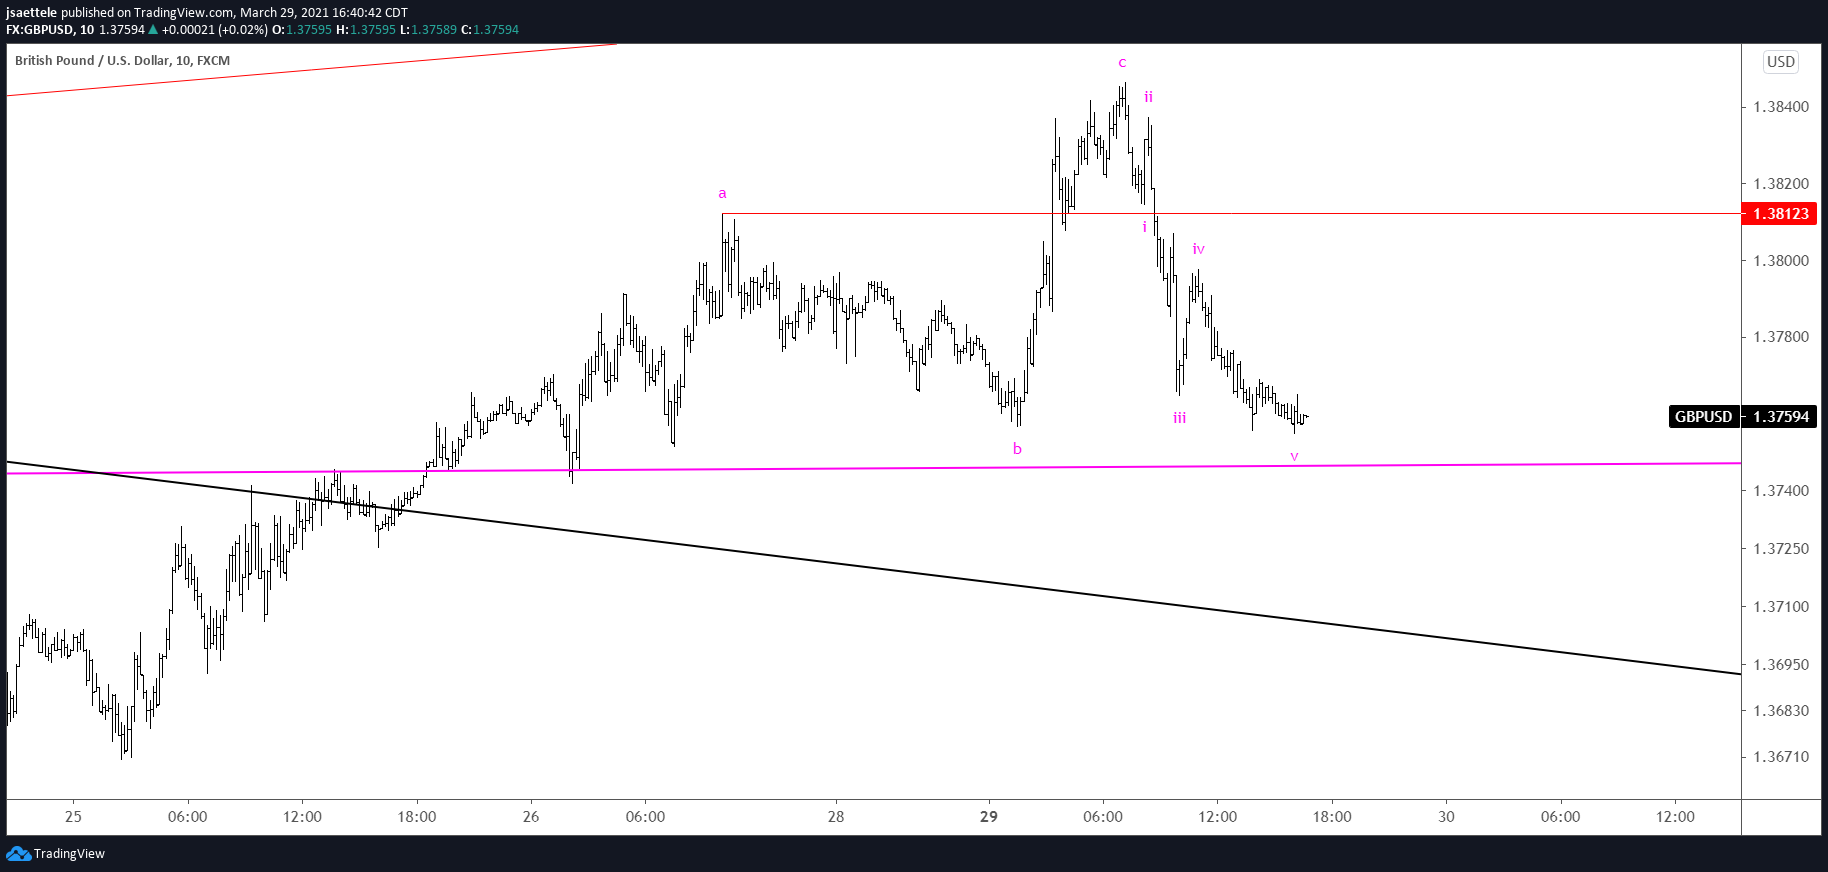
GBPUSD 10 MINUTE
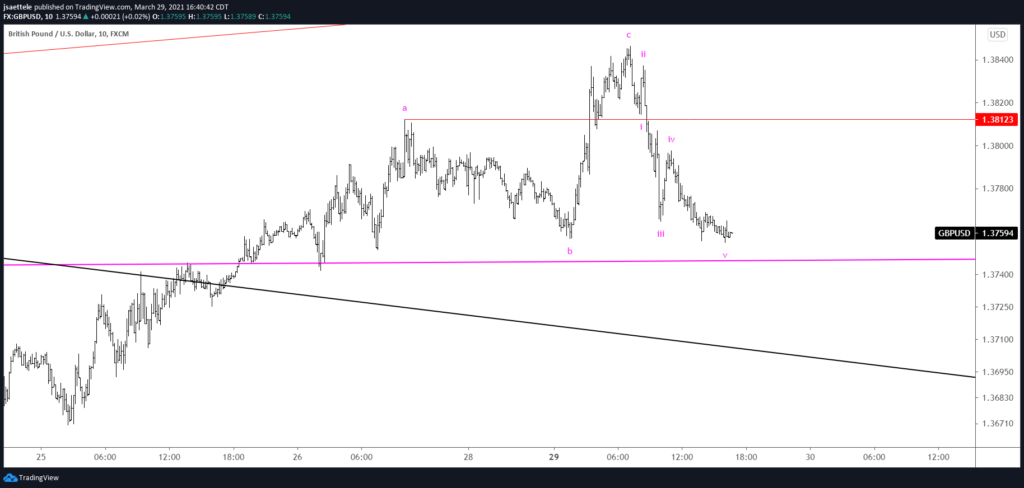
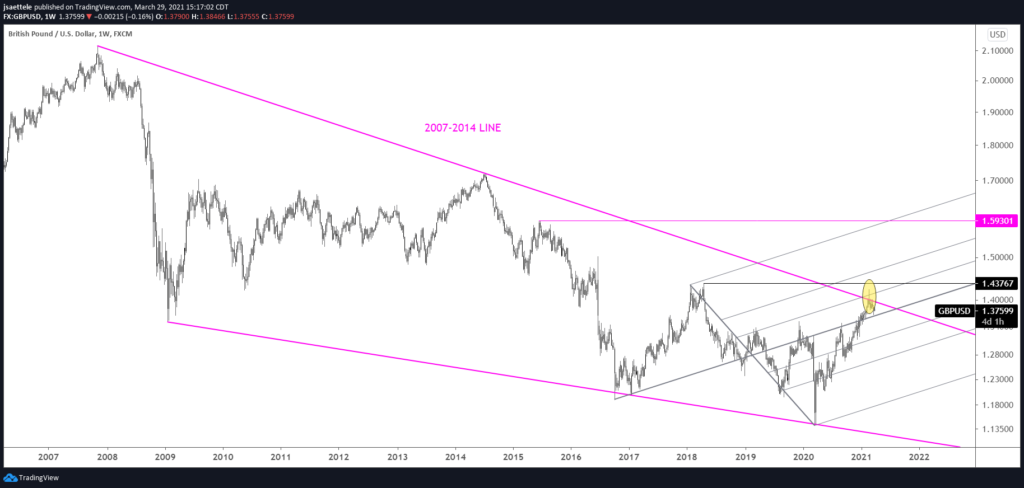
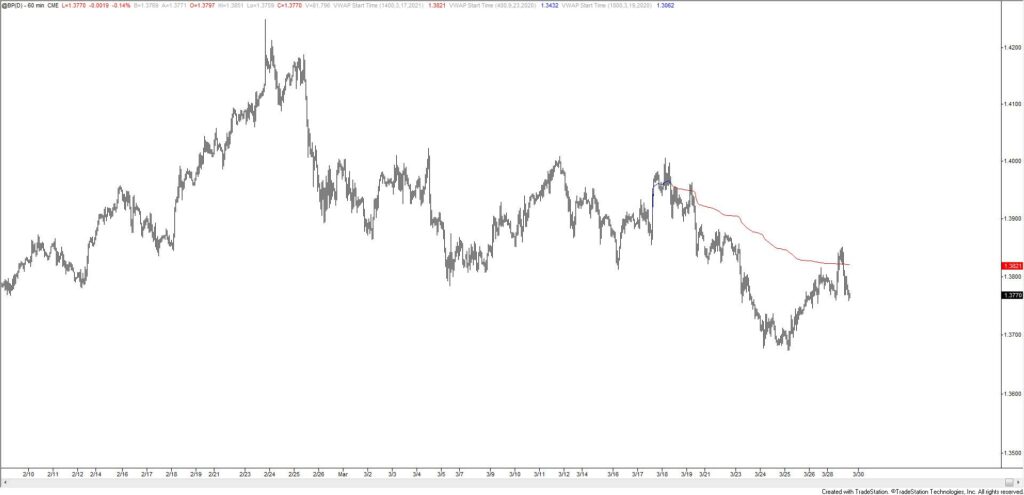
GBPUSD spiked up to 1.3840s today before pulling back. Interestingly, 1.3840 was the level I was looking for resistance last week because that was last week’s open. Better defined resistance is 1.3880 but the rally from the low is in 3 waves and the drop from today’s high is impulsive. I like shorts into 1.3812. Given the failed break above long term trendline resistance last month (see weekly chart below), downside may be significant. Another reason to favor downside against today’s high is the fact that the rally failed near VWAP from February FOMC (see futures chart 2 charts down).
GBPUSD WEEKLY
BRITISH POUND FUTURES HOURLY
AUDUSD 4 HOUR
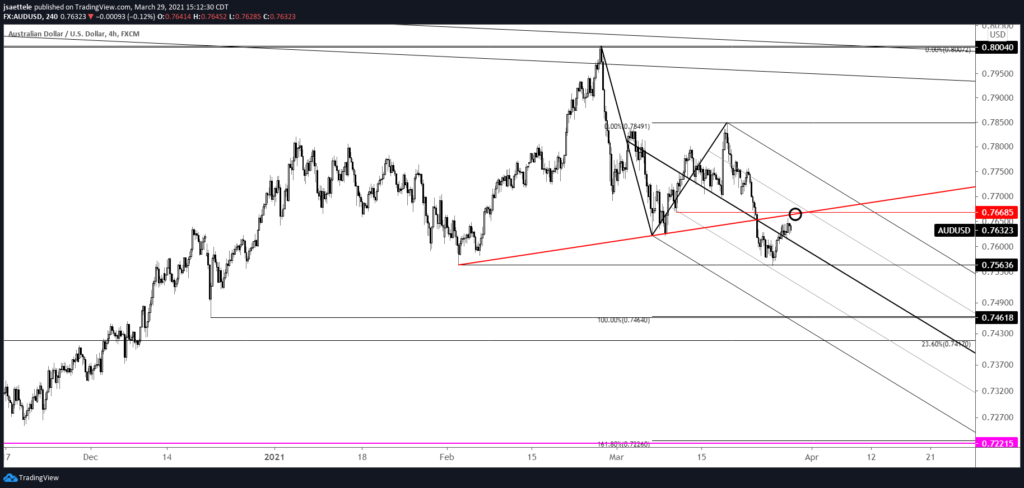
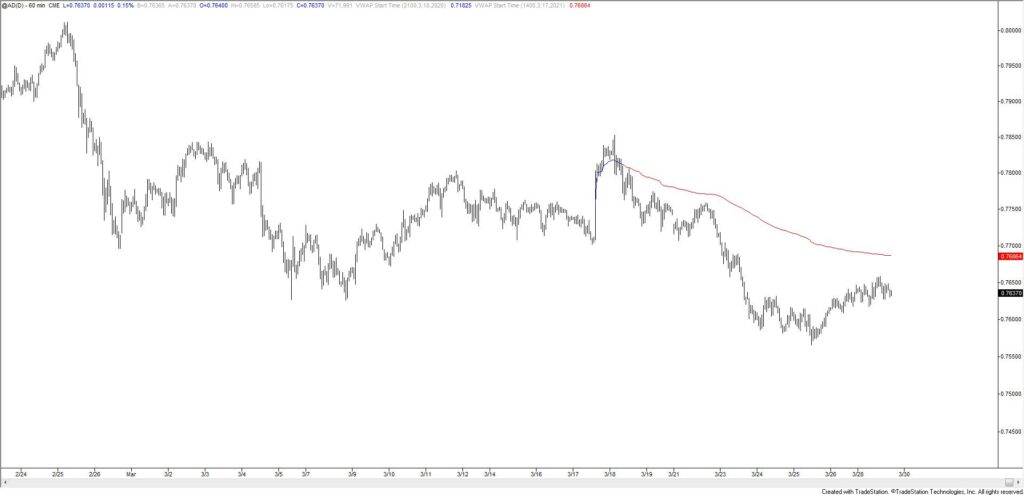
AUDUSD is nearing the noted .7660 (red line). A show of resistance at that level would warrant a short position with focus on .7460s and .7420s (2 legs down and September high). VWAP from FOMC is slightly higher than the underside of the neckline so respect potential for a spike through the line before downside resumes. That VWAP is currently .7686 (see futures chart below).
3/25 – Respect potential for a bounce off of .7564. The setup is to short the underside of the neckline (red line) near .7660. Again, the first downside objective is .7464 but a break below there would open up the head and shoulders target at .7220.
AUSTRALIAN DOLLAR FUTURES HOURLY
NZDUSD 4 HOUR
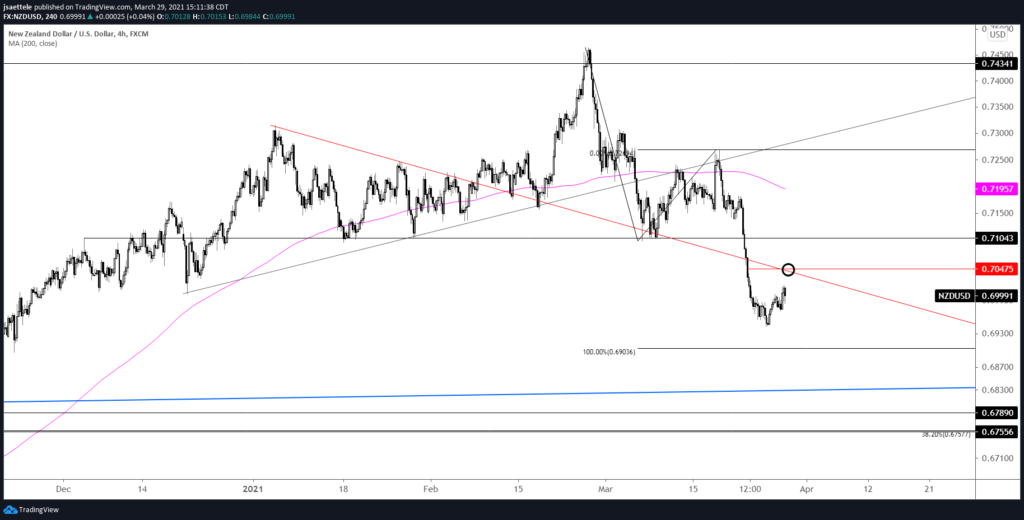
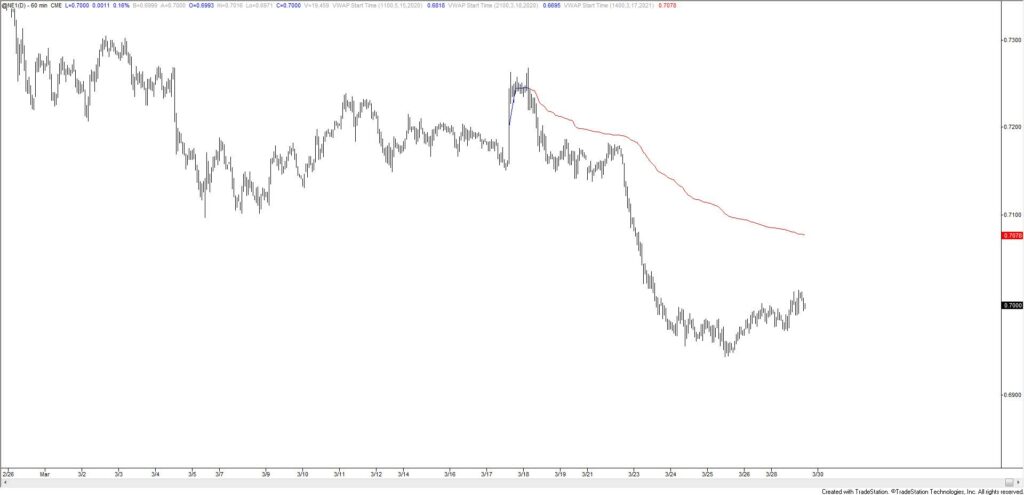
.7050 remains in focus for NZDUSD resistance and downside targets remain .6904 and .6830. Basically, no change! The only other piece of information to share is that VWAP from FOMC is currently .7080. Similar to AUDUSD, VWAP is slightly higher than proposed chart resistance so respect potential for an overshoot above .7050 before the next high.
3/25 – Pay attention to .6904 in NZDUSD, which is where the decline would consist of 2 equal legs. The more important level though is the blue line near .6830. I favor downside until that level is reached, but only on strength. Proposed resistance is .7050.
NEW ZEALAND DOLLAR FUTURES HOURLY
