Market Update 3/30 – Big Spot for USDJPY
EURUSD DAILY
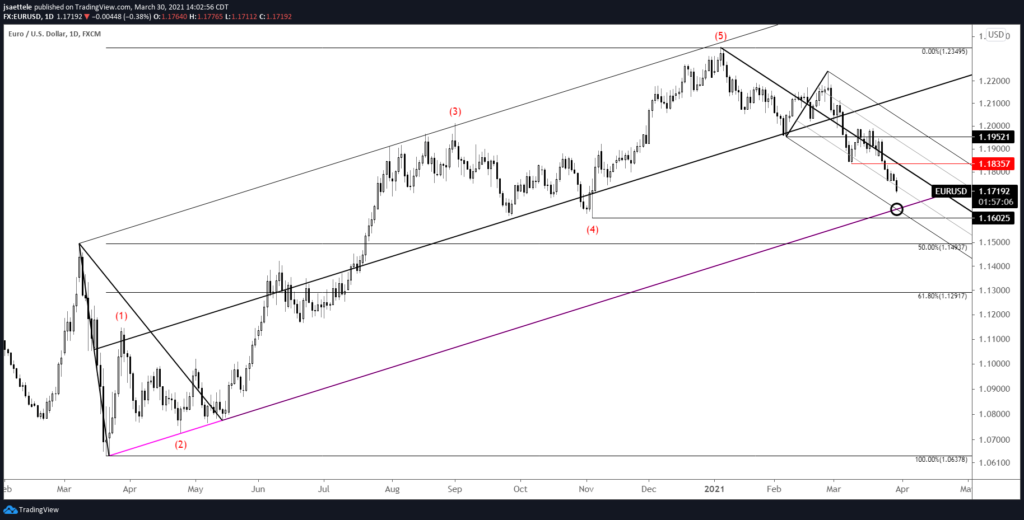
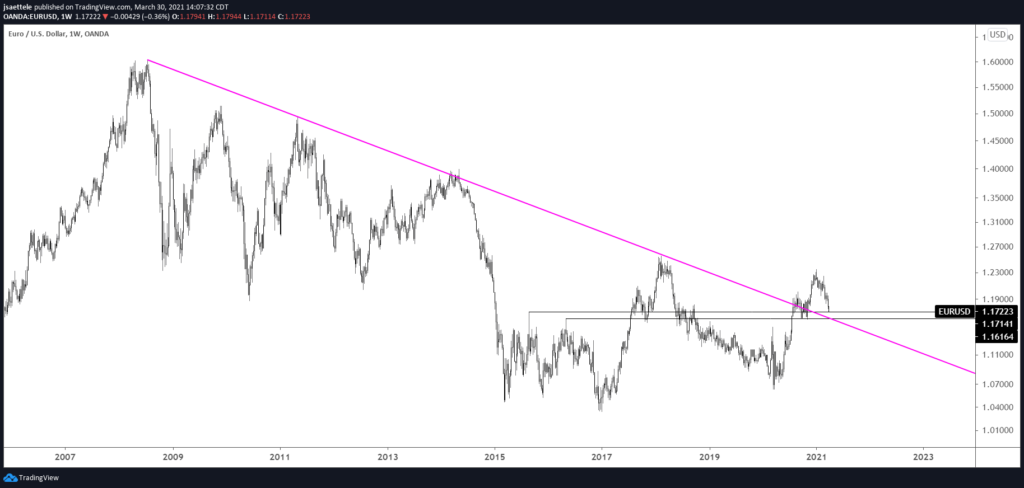
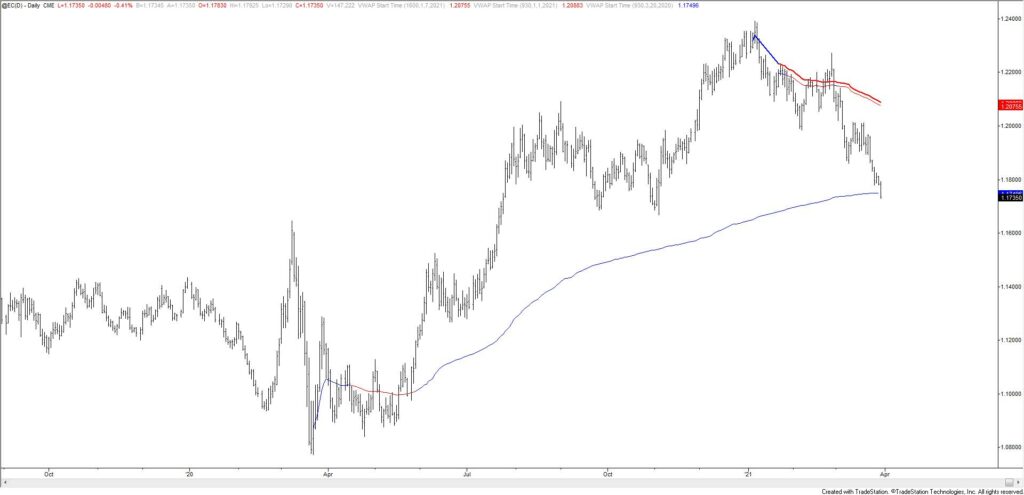
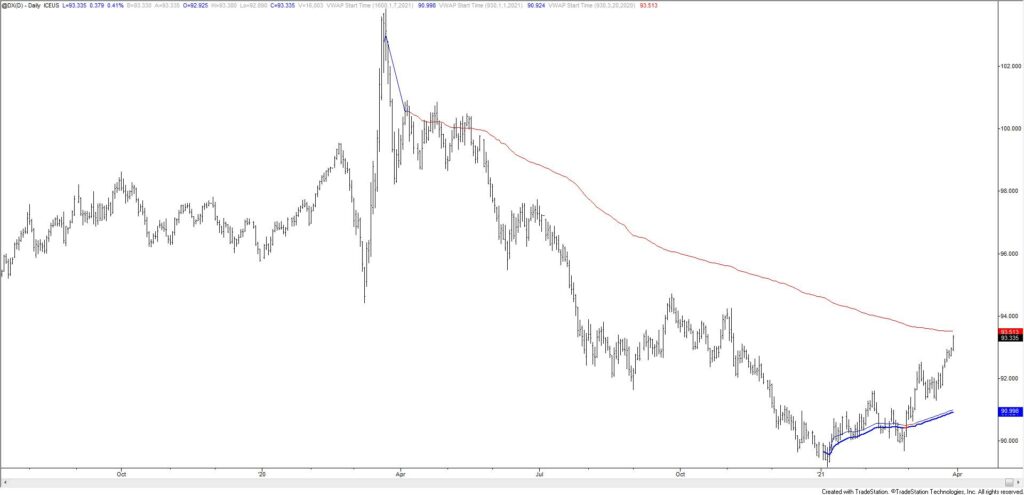
EURUSD continues to drift lower and near term levels of interest haven’t changed. The trendline confluence at 1.1640 remains in focus for possible support and a low. 1.1835 still remains proposed resistance, especially if reached before 1.1640. Generally speaking, EURUSD has entered a ‘sticky’ zone for support (see the weekly chart below) which includes the 2015 high, 2016 high, and top side of former trendline resistance. Also, VWAP from the March 2020 low has been reached (see futures chart 2 charts down). VWAP from the March 2020 high in DX is slightly higher.
3/23 – EURUSD is at the 200 day average for the first time since May. Given the importance of the USDOLLAR median line break, my view is that EURUSD breaks below the important average. Downside focus is the confluence of the lower parallel from the bearish fork and the lower parallel from the channel off of the March 2020 low at 1.1640. 1.1880 is proposed resistance (see below).
EURUSD WEEKLY
EURO FUTURES DAILY
U.S. DOLLAR INDEX FUTURES
USDJPY DAILY
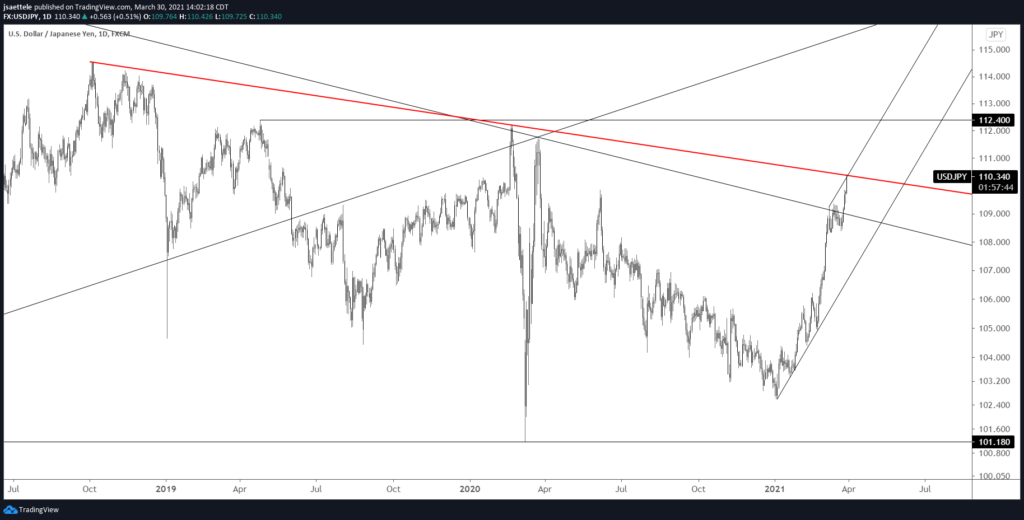
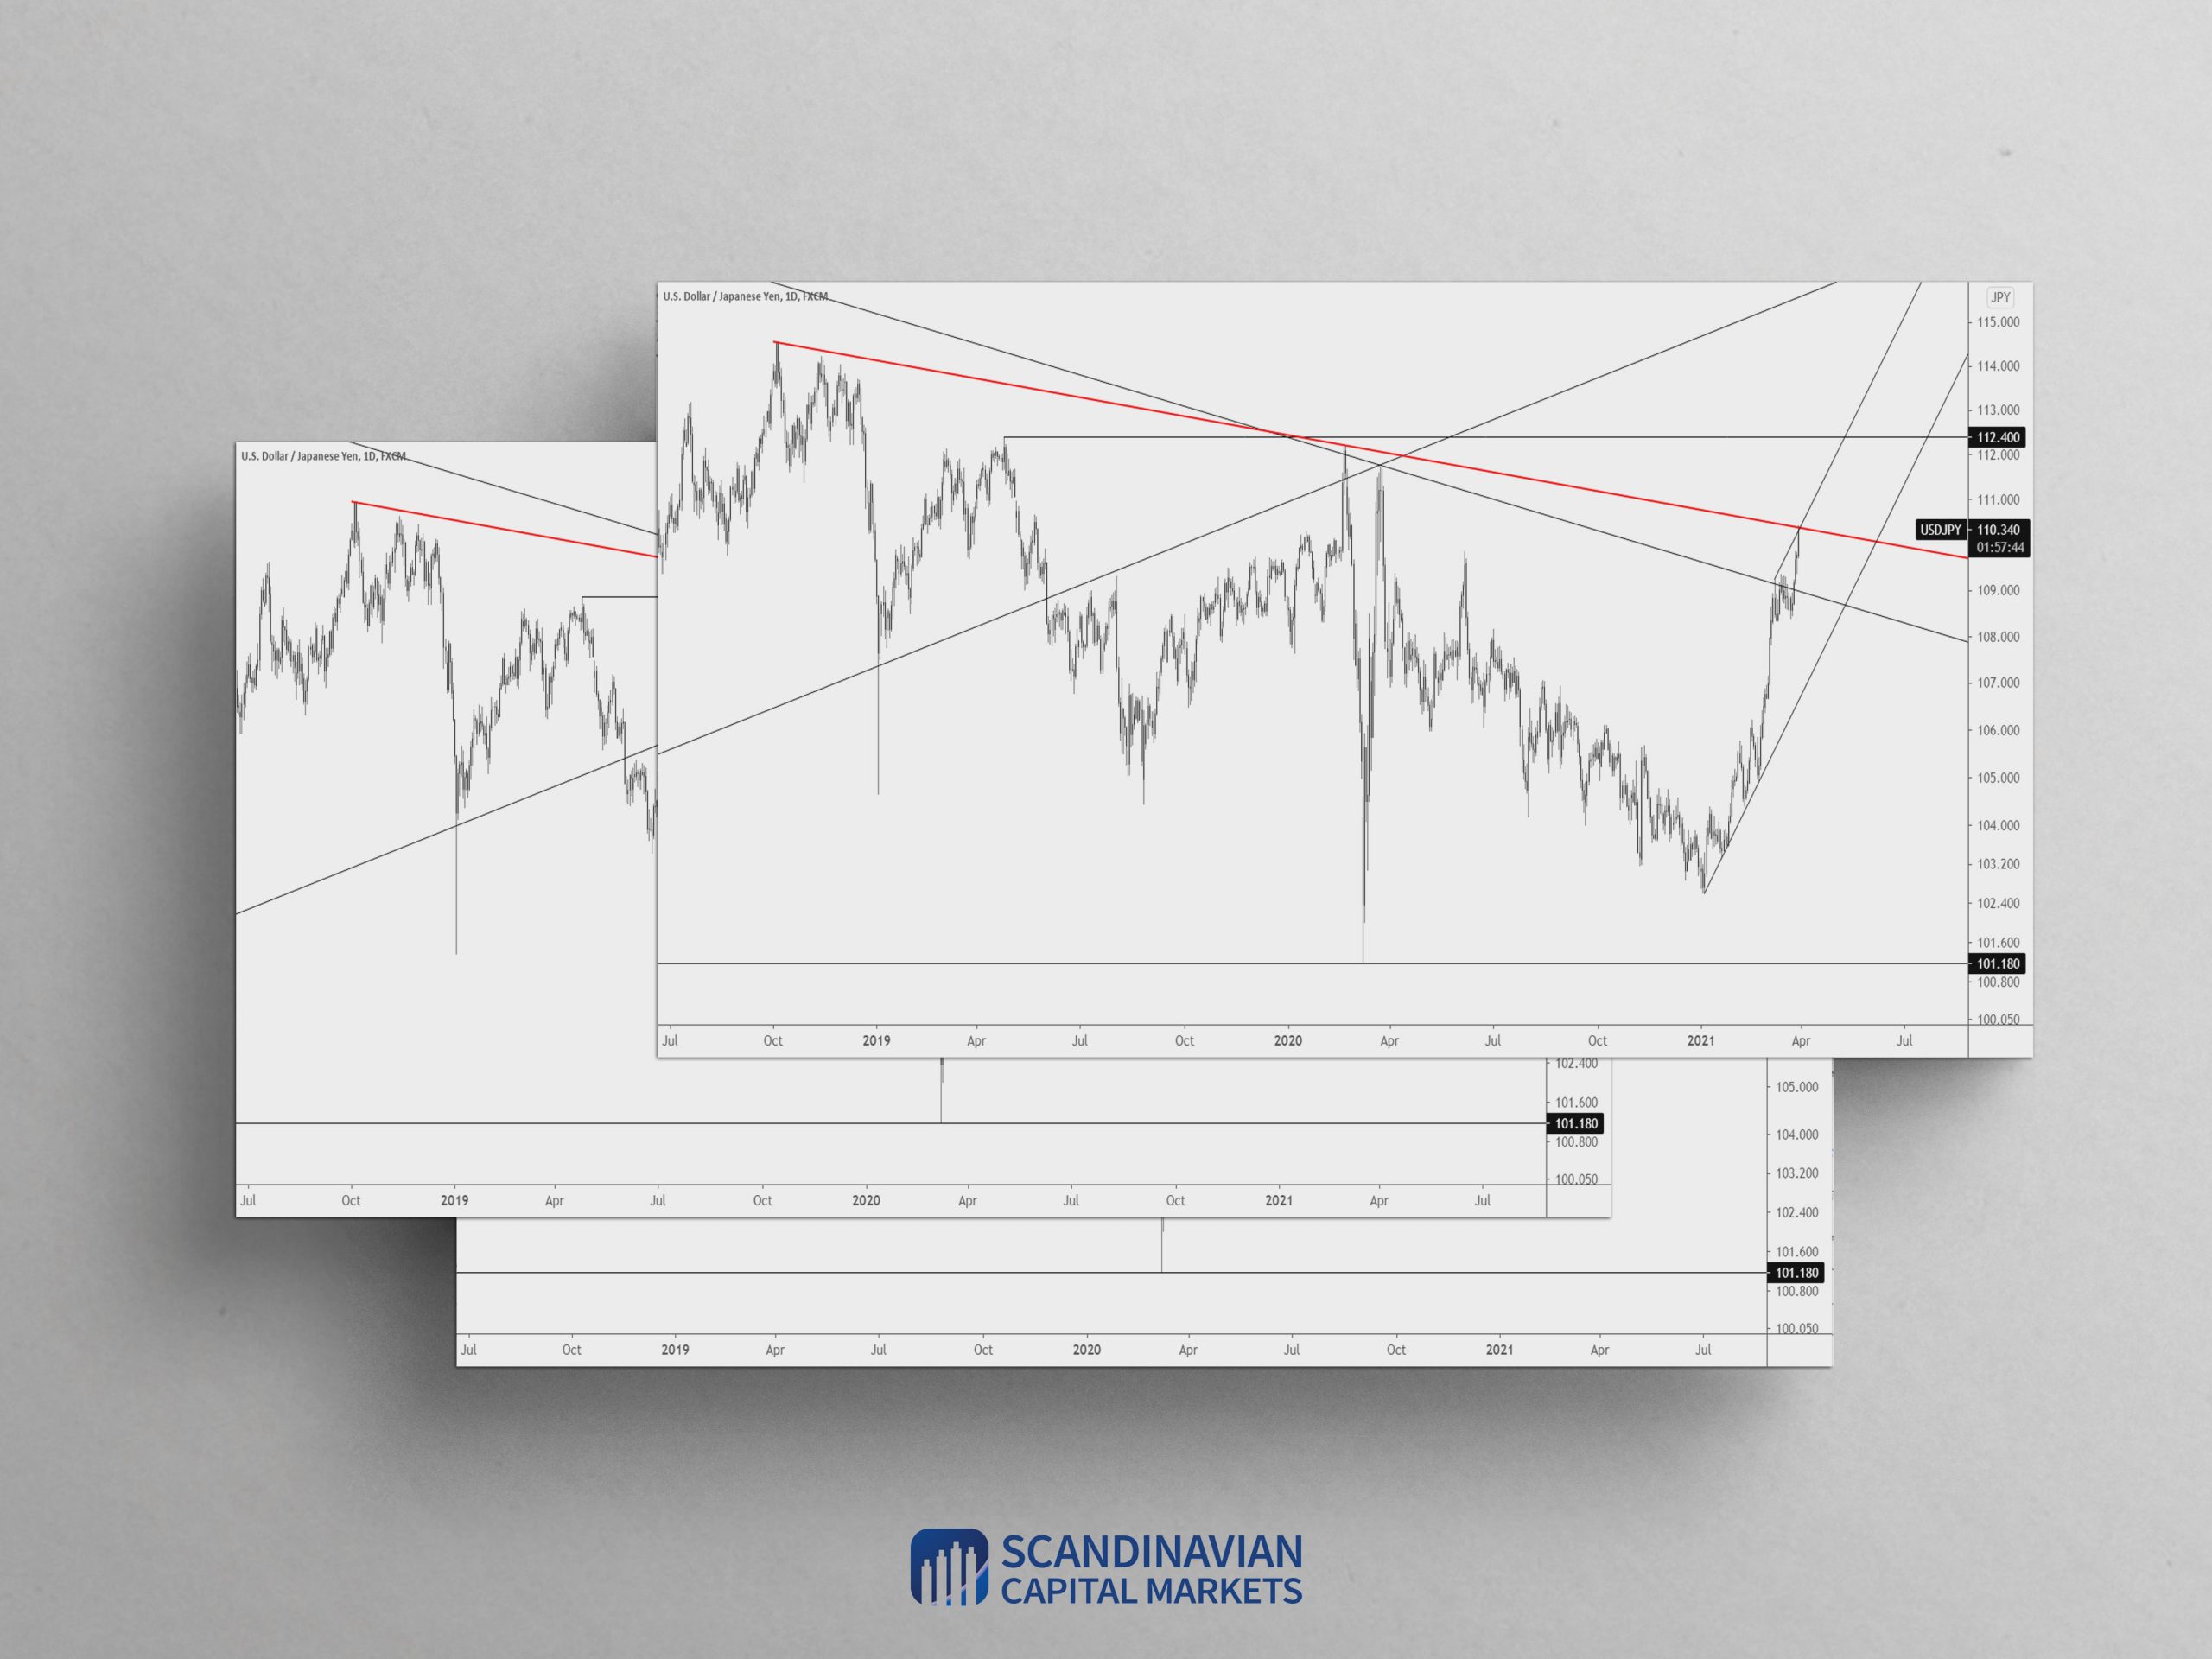
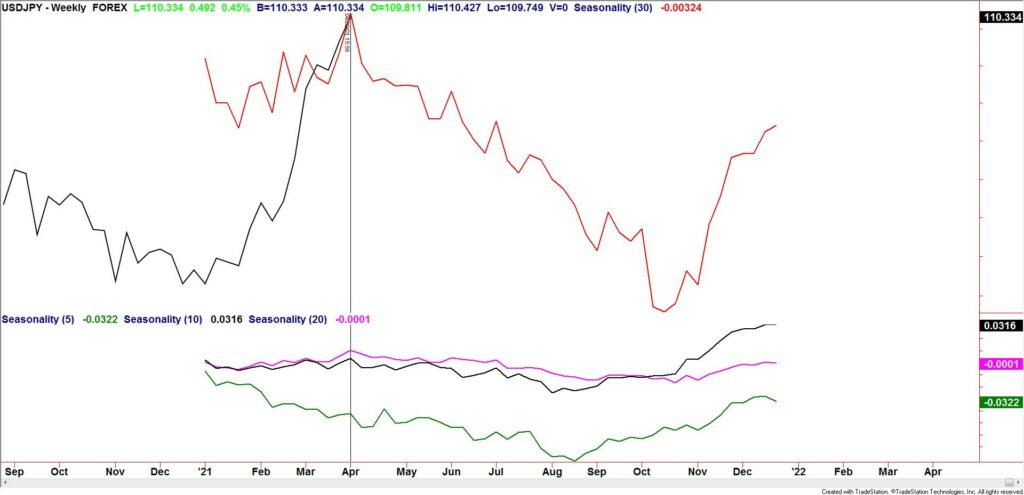
USDJPY continues to rip higher but price has reached an interesting level. The level in question is the line that extends off of the 2018 and 2020 highs. Seasonal tendencies also top this week (see below). This trendline/seasonal combination makes for a great opportunity to fade the move but we need price to suggest that some sort of a top is in place. An intraday volume reversal for example would suffice. Stay tuned.
USDJPY WEEKLY SEASONALITY
AUDUSD 4 HOUR
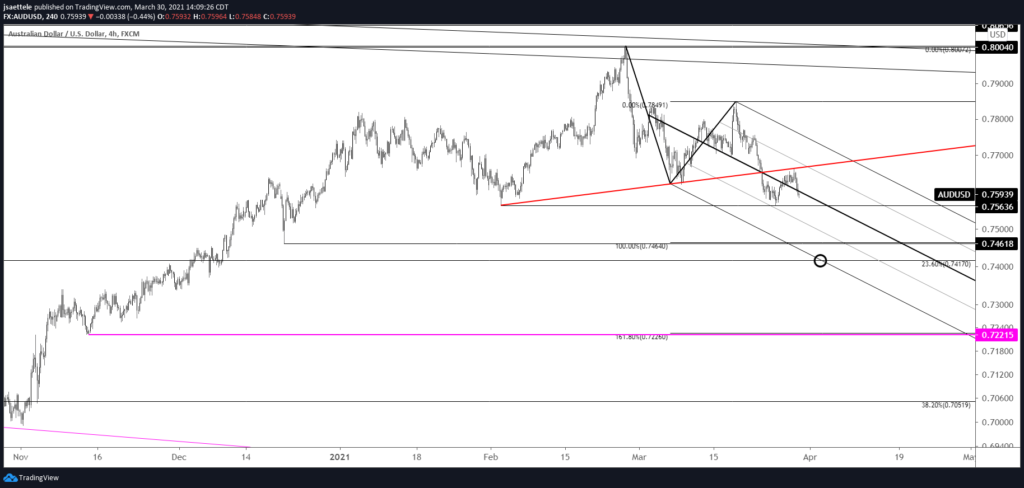
AUDUSD topped right where it should have and focus is lower as long as price is below today’s high. In the event of a bounce, resistance should be .7630s.
3/29 – AUDUSD is nearing the noted .7660 (red line). A show of resistance at that level would warrant a short position with focus on .7460s and .7420s (2 legs down and September high). VWAP from FOMC is slightly higher than the underside of the neckline so respect potential for a spike through the line before downside resumes. That VWAP is currently .7686 (see futures chart below).
NZDUSD 4 HOUR
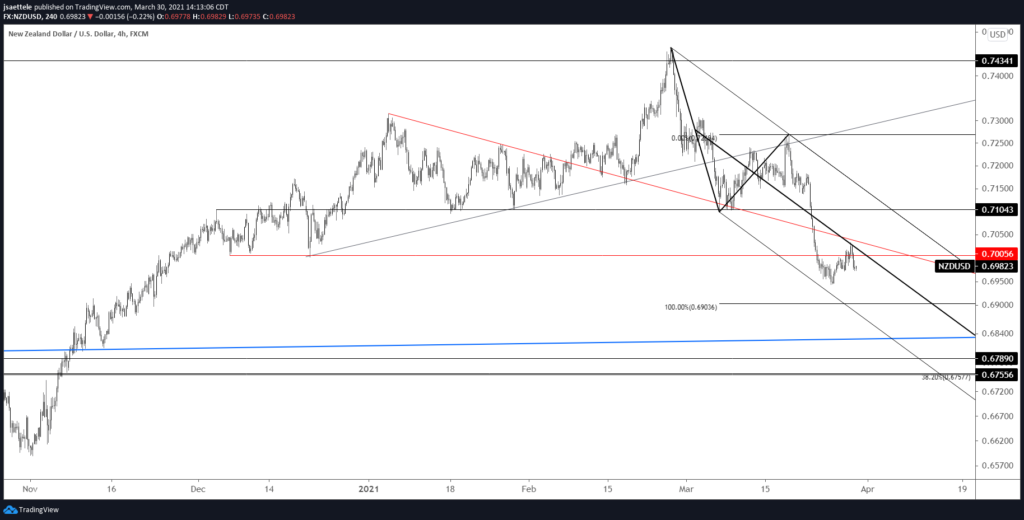
NZDUSD also topped right at the ‘right’ level and focus is likewise lower as long as price is under today’s high. Resistance should be .7000ish. I favor AUDUSD short over NZDUSD short at the moment given signs of failure in AUDNZD at the top of its range.
3/29 – .7050 remains in focus for NZDUSD resistance and downside targets remain .6904 and .6830. Basically, no change! The only other piece of information to share is that VWAP from FOMC is currently .7080. Similar to AUDUSD, VWAP is slightly higher than proposed chart resistance so respect potential for an overshoot above .7050 before the next high.
USDCAD DAILY
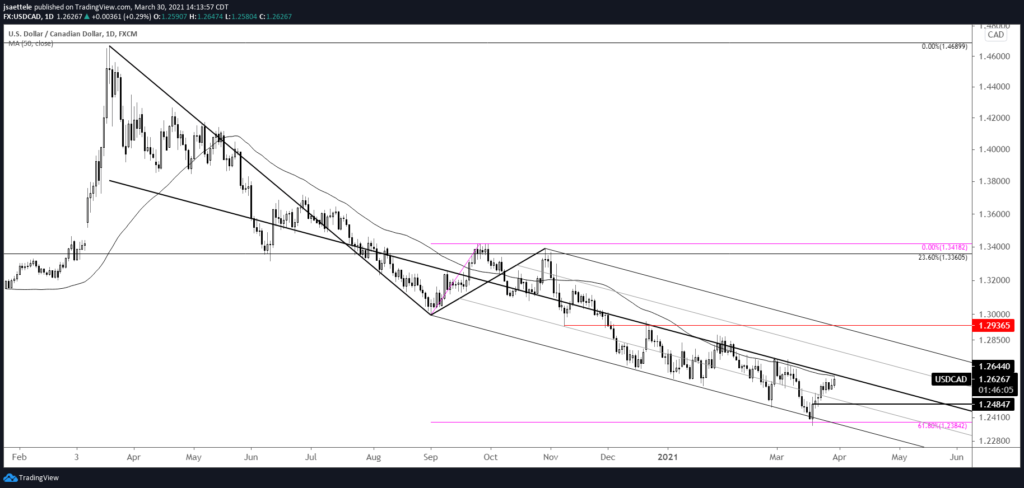
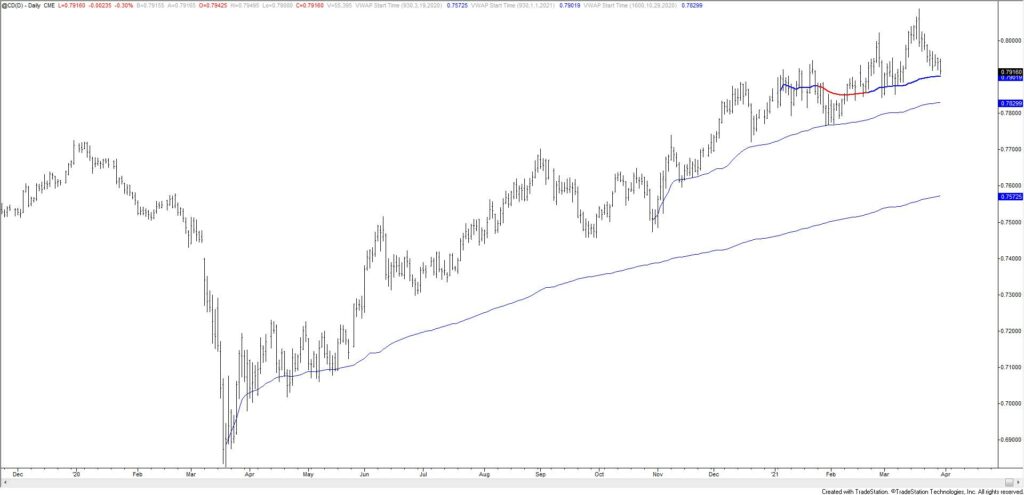
USDCAD tested the median line from the Schiff fork off of the March 2020 high today. This is also the 50 day average, which has been resistance since late January. 2021 VWAP is also nearby (see futures chart below). This is a good spot for a pullback. In that event, proposed support is 1.2487 (3/18 reversal day close).
3/23 – 1.2670 is a spot to know in USDCAD (circled). Notice how price immediately retraced today’s drop on BoC news. That kind of reaction suggests that USDCAD is bullish. It’s not the news that matters, it’s the reaction to the news that matters. Last week’s high at 1.2548 is proposed support.
CANADIAN DOLLAR FUTURES DAILY
